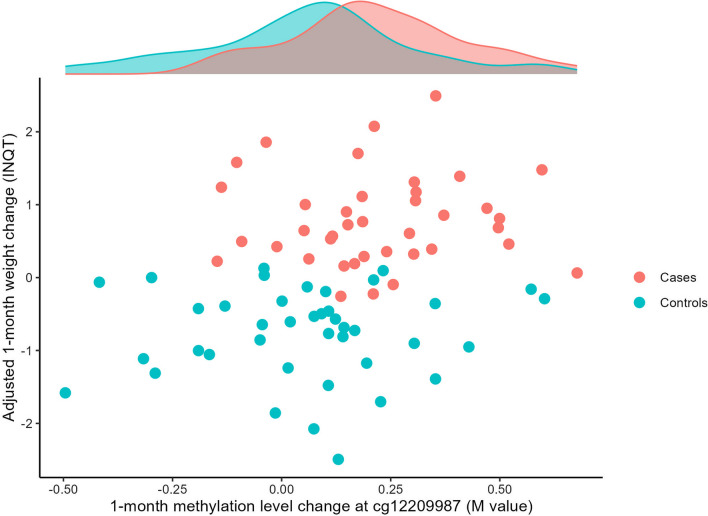
Fig. 1.
Association between 1-month methylation level change at cg12209987 and weight change. Weight change was adjusted for baseline BMI, smoking status, sex, age, treatment propensity to induce weight gain and the first three principal components of methylation data, and normalized using an inverse normal quantile transformation (INQT). The methylation level change was assessed using the M-value metric. Patients who gained 5% or more of their initial weight were considered cases, and patients whose weight remained stable were considered controls

