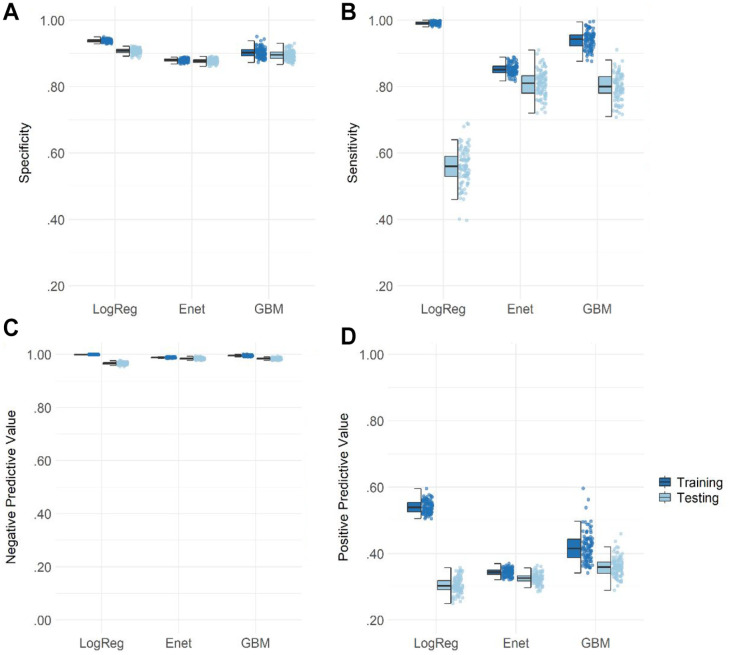
Figure 2.
Specificity, Sensitivity, and Negative and Positive Predictive Values for Predicting Suicide Attempts in Adolescents in Model 3
Note. LogReg = logistic regression, Enet = elastic net regression, GBM = gradient boosting machines. The boxplot reflects the interquartile range, the solid line represents the median, and the whiskers 1.5-times the interquartile range. Specificities (A), sensitivities (B), negative predictive values (C), and positive predictive values (D) are displayed as jittered distribution on the right.

