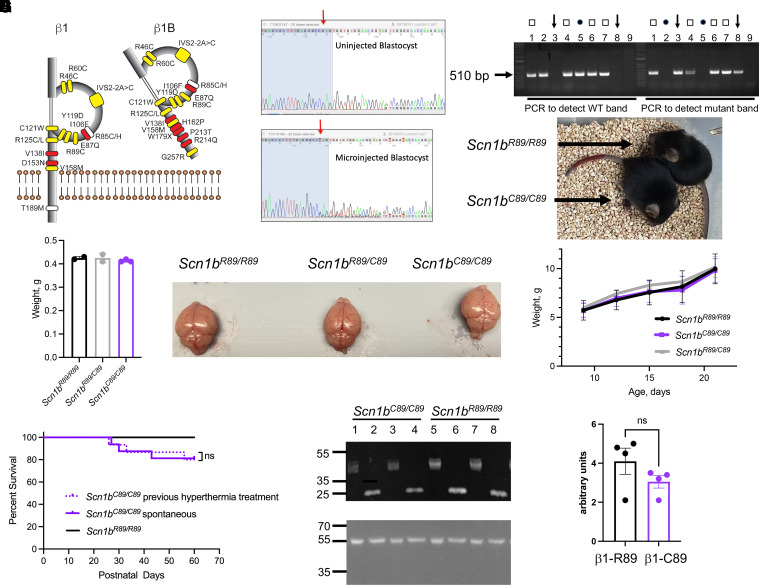
Figure 1.
Generation and characterization of Scn1bR89/C89 mice. (A) Known disease variants in VGSC β1 and β1B subunits. Adapted from O’Malley et al.15 Yellow: variants associated with epilepsy. White: variants associated with epilepsy and cardiac arrhythmia. Red: variants associated with sudden cardiac death. Residue R89, yellow, is located within the Ig loop domain of β1 and β1B and is evolutionarily conserved throughout vertebrate VGSCs (GeneCards The Human Gene Database, https://media.githubusercontent.com/media/aminodektc/70/master/SCN1B/SCN1B.png). (B) sgRNAs were complexed with ESPCas9 protein and injected into fertilized mouse eggs. A DNA genomic fragment spanning the expected Cas9 cut site was PCR amplified and sequenced analysis. Cas9-induced double-strand breaks resulted in the presence of superimposed sequences (peaks-on-peaks) starting near the expected Cas9 cut site. sgRNA C130G1 produced indel mutations in three of five test blastocysts. Arrow: Cas9 cut site. Blue-shaded nucleotides: sgRNA target. (C) Representative genotyping experiment in which two separate PCRs were run for each tail DNA for Scn1bR89/R89, Scn1bR89/C89 and Scn1bC89/C89 pups to detect WT and mutant Scn1b bands, respectively. Lanes 1, 4, 6 and 7: Scn1bR89/C89 and show both WT and mutant bands (squares); Lanes 2 and 5: Scn1bR89/R89 and show WT bands only (circles); Lanes 3 and 8: Scn1bC89/C89 and show mutant bands only (arrows). (D) Upper: Comparison of littermate P19 Scn1bR89/R89 and Scn1bC89/C89 animals. Lower: Comparison of Scn1bR89/R89 (N = 3), Scn1bR89/C89 (n = 5) and Scn1bC89/C89 (n = 5) male and female weights from P9 to P21. No significant differences between genotypes (mean +/− SD, one-way ANOVA). (E) Left: Comparison of whole brain weights per genotype at P21 showing no statistical differences (mean +/− SD, one-way ANOVA). Right: Comparison of acutely dissected brains of littermate Scn1bR89/R89, Scn1bR89/C89 and Scn1bC89/C89 animals at P21. (F) Kaplan–Meier analysis of life span shows that ∼20% of Scn1bC89/C89 animals die by P60. Dotted purple line: Scn1bC89/C89 animals pre-treated with hyperthermia at P15 and then allowed to develop (n = 15). Solid purple line: non–pre-treated Scn1bC89/C89 animals (n = 16). Solid black line: non–pre-treated Scn1bR89/R89 animals (n = 31). No significant differences between pre-treated and non–pre-treated groups (ns, Log-rank Mantel–Cox test). Male and female animals were included in each group. Original, uncropped blots shown in Supplementary Fig. 1. (G) Expression of β1 polypeptides in P60-90 Scn1bR89/R89 and Scn1bC89/C89 brains. Lanes 1–4: Scn1bC89/C89. Lanes 5–8: Scn1bR89/R89. Odd numbered samples are untreated and thus glycosylated. Even numbered samples were deglycosylated with PNGaseF. (H) Densitometric quantification of deglycosylated β1 polypeptides from Scn1bR89/R89 (β1-R89) and Scn1bC89/C89 (β1-C89) brains. Deglycosylated β1 (∼22 kDa) immunoreactive bands were normalized to loading control anti–α-tubulin signal. n = 4 Scn1bR89/R89 and 4 Scn1bC89/C89 samples. No significant differences between groups (mean +/− SEM, P = 0.2, unpaired t-test).

