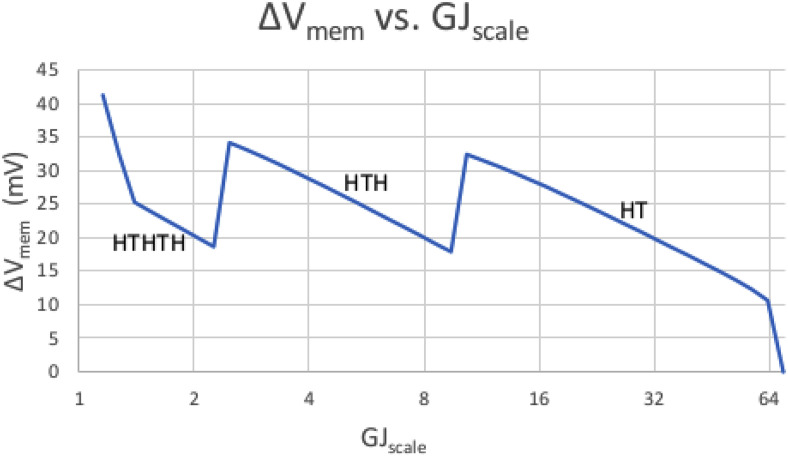
FIG. 1.
The effect of GJscale on ΔVmem. The x axis represents GJscale (i.e., the density of GJs relative to an arbitrary reference); the y axis is ΔVmem (the difference between the highest and lowest Vmem anywhere in the worm). Each portion of the graph is also labeled with the worm's overall pattern of heads and tails, as read from the peaks and valleys of Vmem distribution across the worm. The right side of the graph shows ΔVmem forced to near zero when GJs are too dense. As we move to the left, the lessening GJ conductivity allows the formation of more and more voltage islands and allows Vmem to swing high and low more and more times (where, e.g., HTH would represent a Vmem peak at each end with a valley in the middle).

