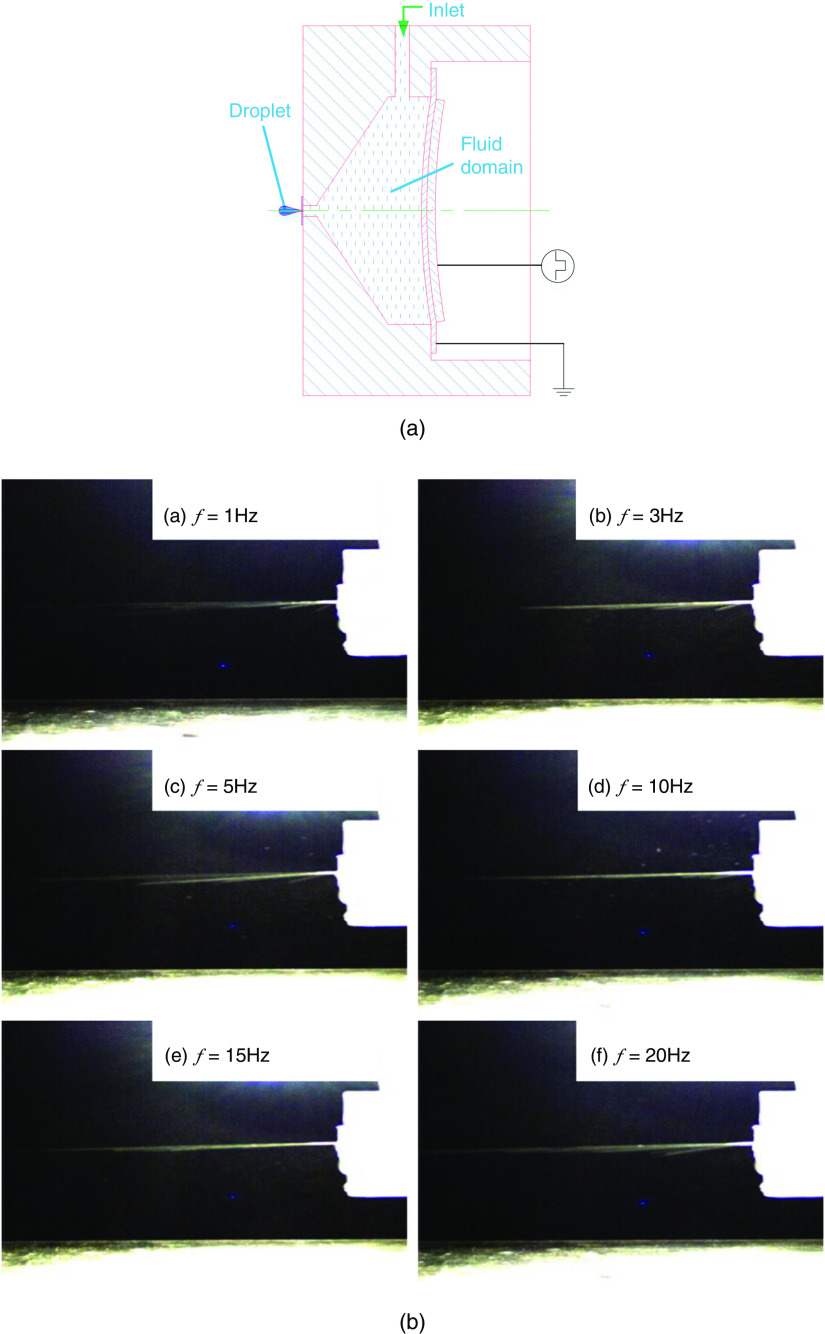
FIG. 19.
Schematic picture of the piezoelectric micro-jet and the injection status (at time t = 1 T) of the micro-jet when operating at different frequencies. Reprinted with permission from Li et al., Ceramics Int. 43, S27-S35 (2017).132 Copyright 2017 Elsevier.

