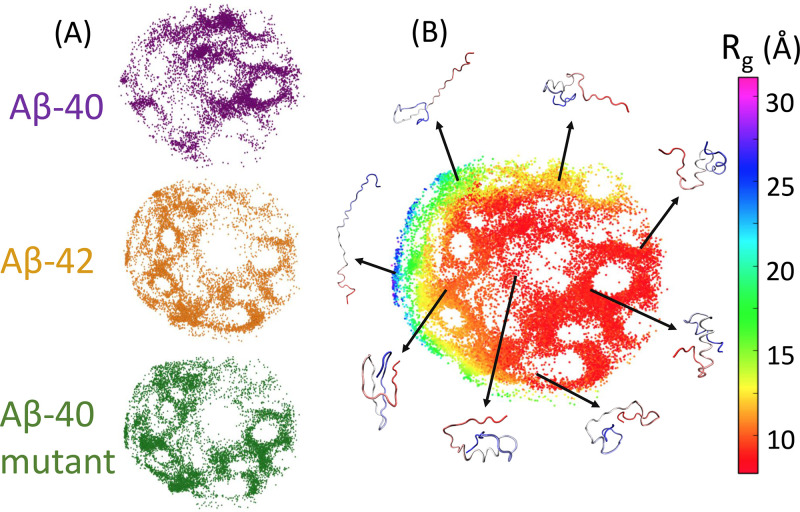
FIG. 2.
Conformational phase space of the simulated amyloid-β (Ab) structures. (a) Distinct Ab ensembles present in the projection with the Ab-40 (purple), Ab-42 (beige), and the Ab-40 mutants (green). (b) Each point represents a conformation, which is colored as function of radius of gyration. Typical conformation examples of each region are displayed around the projection.

