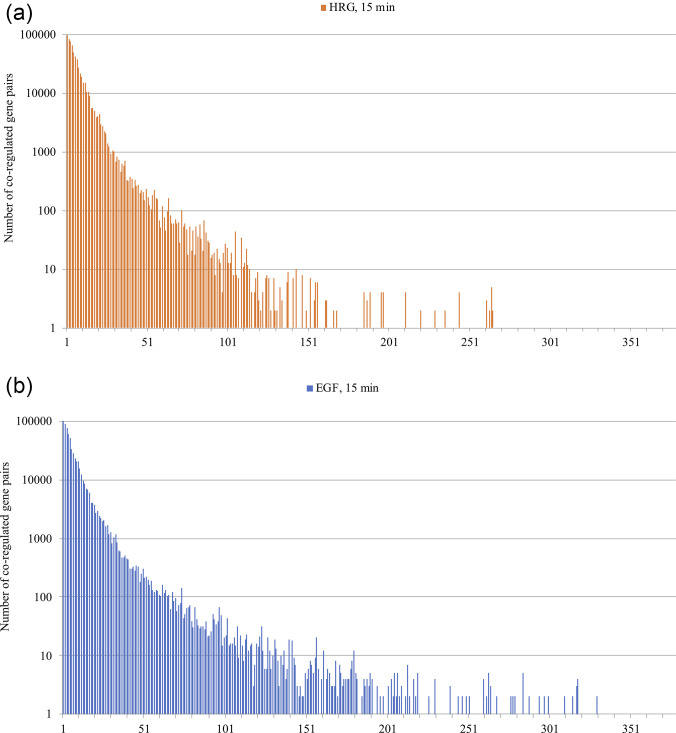
FIG. 2.
Recurrence spectrum along the chromosome 1. The graphs are relative to HRG (top) and EGF (bottom) conditions as for time 15 min and chromosome 1. The y axis corresponds to the number of recurrences (number of co-regulated gene pairs). The x axis corresponds to the spacing of recurrent couples along the chromosome. The spacing is expressed in terms of number of genes between the recurrent pairs. The exponential decay of co-regulation entity with the increasing between genes spacing is identical for different times of observation, different chromosomes, and for the two EGF and HRG conditions. The local character of fine co-regulation around cell-kind specific value is the same for all the experiments.

