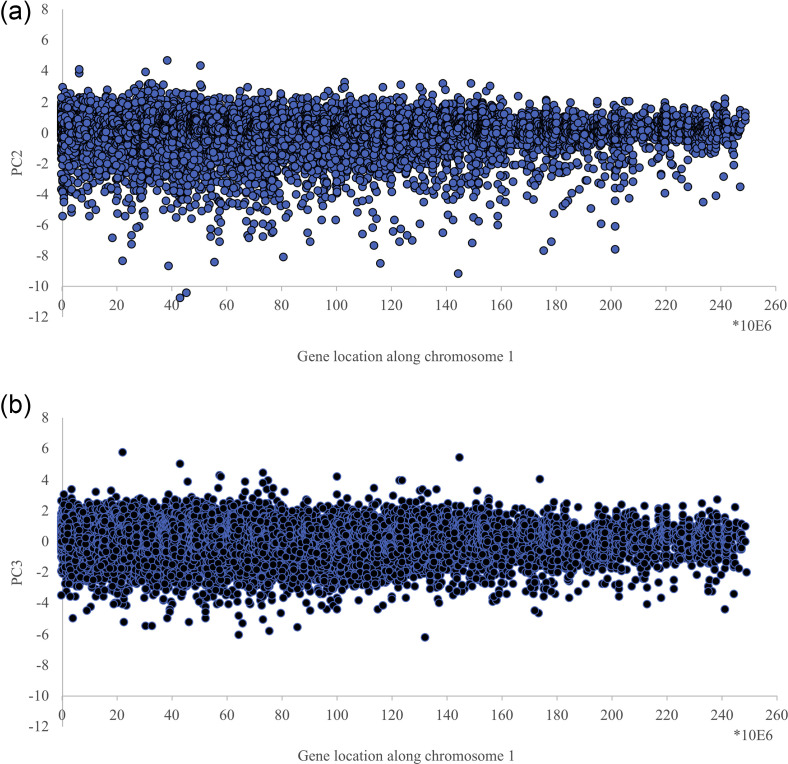
FIG. 3.
Distribution of PC2 and PC3 scores along chromosome 1. The x axis is the gene location along chromosome 1, while the y axis reports the correspondent PC2 (top panel) and PC3 (bottom panel) scores. The figure refers to chromosome 1 EGF at 15 min. but the same general pattern is identical across all the analyzed conditions.

