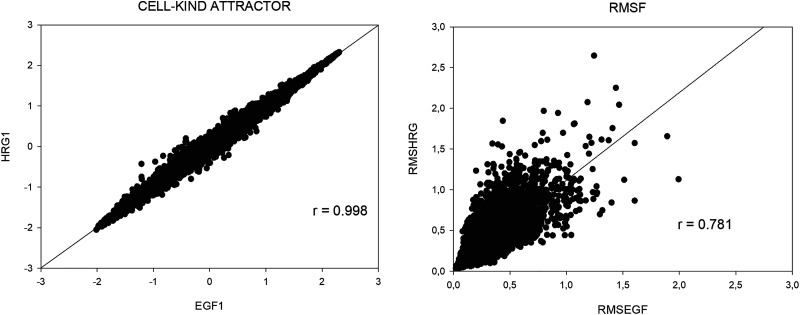
FIG. 7.
EGF and HRG comparison. (a) Left panel has as axis the first component of the two conditions (HRG1 and EGF1, respectively). The near-to-unity correlation of HRG1 and EGF1 scores demonstrates that the first component corresponds to the cell-kind (shared by the two conditions). (b) Right panel shows the single-gene fluctuation in time (rmsf) correlates between the two EGF and HRG cases, pointing to the fact that “fluctuation entity” is an intrinsic property of each gene largely independent of the nature of the stimulus.

