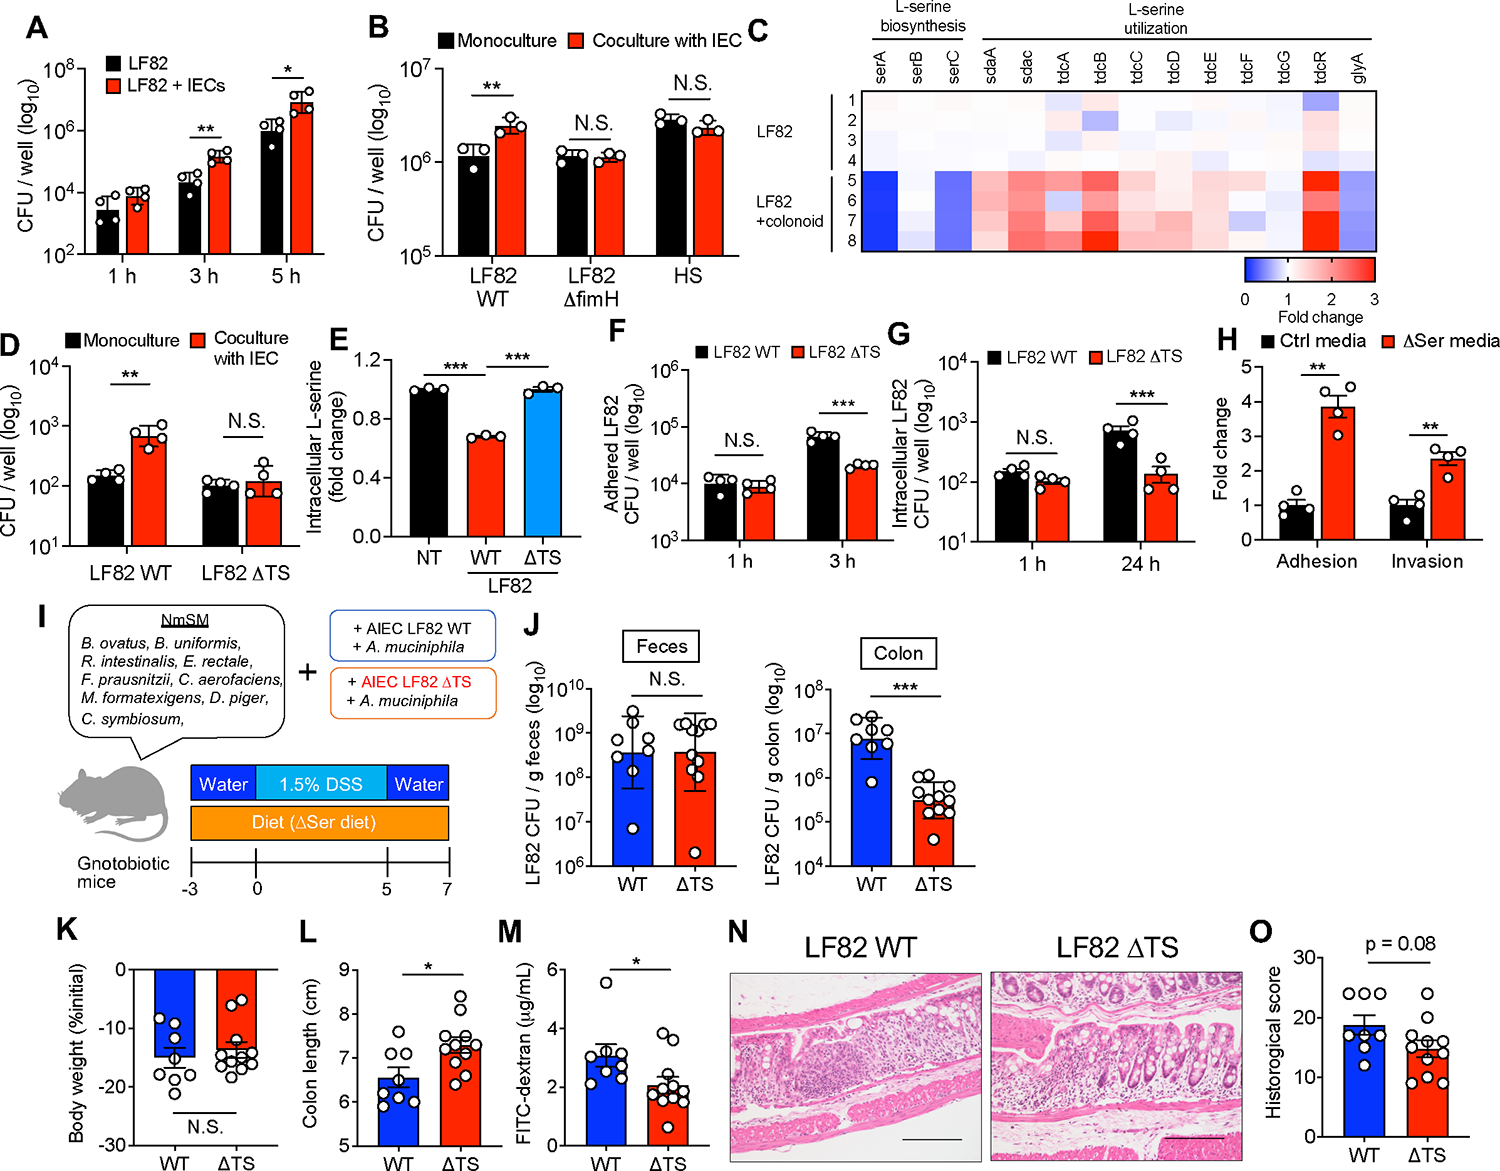
Figure 7. L-serine utilization by AIEC is a partial requirement for the exacerbation of colitis under L-serine deprivation.

(A and B) E. coli strains were cultured with and without T84 cells. After 1–5 h infection, the CFUs of total bacteria, including adhered and nonadhered bacteria, were counted.
(C) AIEC LF82 was monocultured or cocultured with the human-derived colonoid monolayer (HCM) for 3 h, and the transcriptomic profiles were evaluated by RNA-seq. The heat map shows fold changes of L-serine metabolism genes (LF82 + HCM/LF82).
(D) LF82 WT or ΔTS mutant strains were infected in T84 cells for 5 h, and then the CFUs of total bacteria were counted.
(E) Fold changes of intracellular L-serine after infection of T84 cells with AIEC strain LF82.
(F) T84 cells were infected with LF82 WT or ΔTS mutant strains. After 3 h, adhesion bacteria were counted.
(G) T84 cells were infected with LF82 WT or ΔTS mutant strains. After 1 h, the cells were cultured with gentamicin (100 μg/mL) for 24 h. Intracellular bacteria were plated on LB agar plates and counted.
(H) LF82 and T84 cells were cocultured in the Ctrl media or ΔSer media. After a 3 h infection, adhesion and invasion bacteria were plated on LB agar plates and counted.
(I) Experimental design. GF mice were colonized by nonmucolytic synthetic human gut microbiota (NmSM) and A. muciniphila with LF82 WT or ΔTS mutant strains.
(J) On day 7 post-DSS, all mice were euthanized, and the LF82 burden in the colon and feces was assessed.
(K and L) Body weight and colon length.
(M) Intestinal permeability was evaluated by FITC–dextran assay.
(N and O) Representative histological images (scale bar, 200 μm) and histology scores were evaluated.
(A–H) Data are representative of two or three independent experiments (N = 3–4). (J–O) Data pooled from two independent experiments (N = 4–7). Dots indicate individual mice, with mean ± SEM or geographic mean ± SD. N.S., not significant. *p < 0.05, **p < 0.01, ***p < 0.001 by 1-way ANOVA with Tukey post hoc test or unpaired t test. See also Figure S4.
