
Fig 3. SHAP summary plots.
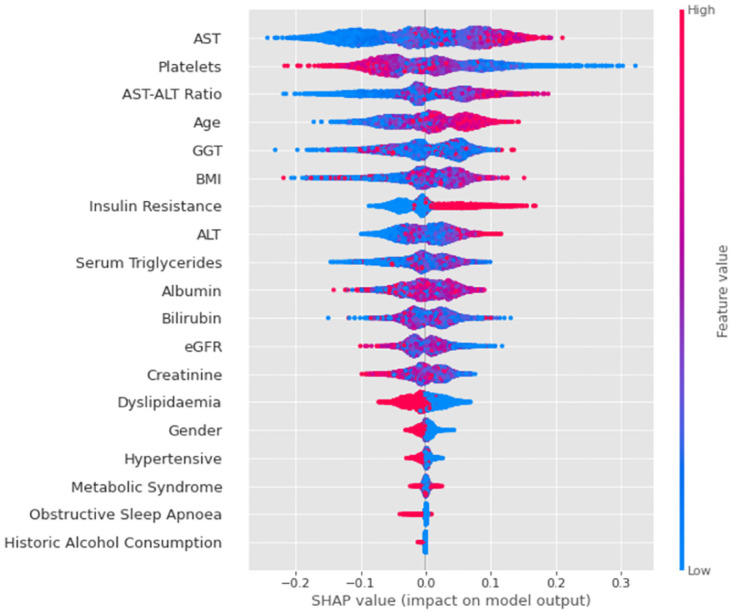
Ranking of Core variables in terms of their influence on predicting At-Risk MASH for XGBoost with MICE and SMOTE model.
Official websites use .gov
A
.gov website belongs to an official
government organization in the United States.
Secure .gov websites use HTTPS
A lock (
) or https:// means you've safely
connected to the .gov website. Share sensitive
information only on official, secure websites.
Ranking of Core variables in terms of their influence on predicting At-Risk MASH for XGBoost with MICE and SMOTE model.