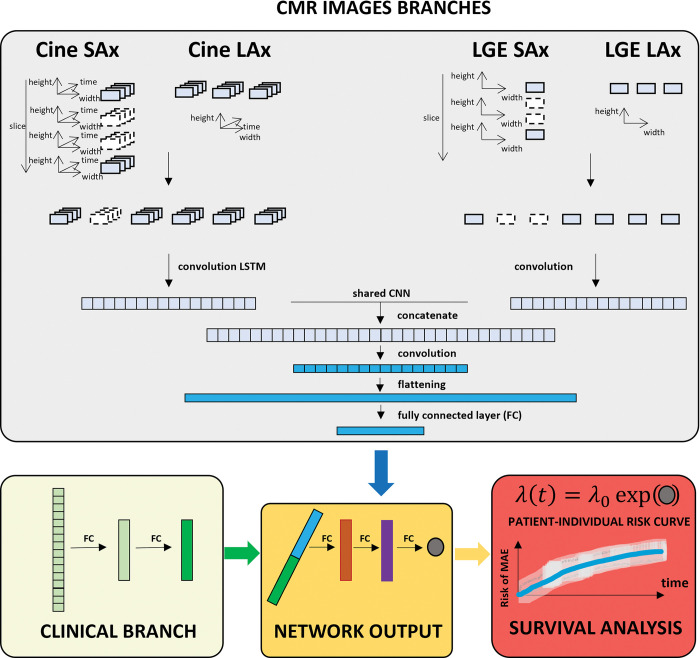
Fig 2. Schematic overview of DARP-D.
Top panel (grey) shows the first two branches of the model, which use, respectively, unprocessed cine- and LGE- CMR data. Cine-CMR hypervideos are taken as input by a 4D and 3D convolutional long term short memory network constructed using an encoder architecture. LGE-CMR hyperimages are taken as input by a 3D and 2D convolutional neural network. These two branches convey in a common network (shared convolutional neural network) determining a one dimensional output of shape 8. Left bottom panel (yellow) shows the covariate branch, which consists of two consecutive sets of 8 fully connected networks producing a tensor of shape 8. Bottom central panel (orange) shows the final single fully connected network that uses as inputs the tensors from CMR and covariate networks to give a one dimensional output of shape 1. Right bottom (red) panel shows the survival model, where the output of shape 1 is used to directly estimate the individual nonlinear log-risk function .

