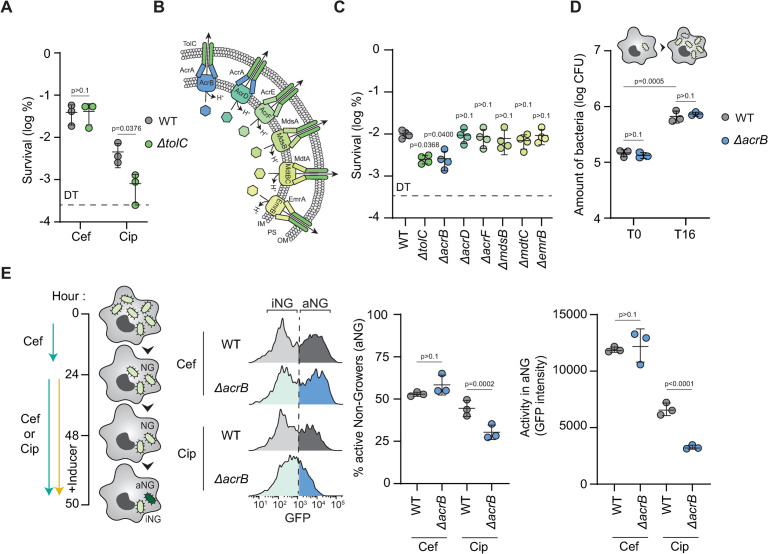
Fig 2. AcrAB-TolC efflux machinery contributes to persister survival during ciprofloxacin treatment within host cells.
(A) 48 h cefotaxime or ciprofloxacin survival of WT (gray) or ΔtolC (green) Salmonella in WT Mφ normalized to values after 30 min internalization. p values are indicated (ANOVA with Tukey’s correction for multiple comparisons); error bars depict means and standard deviation (SD); n = 3. DT: Detection Threshold. (B) Illustration of TolC-dependent efflux machineries of Salmonella. IM: Inner Membrane, PS: Periplasmic Space, OM: Outer Membrane. (C) 48 h ciprofloxacin survival of WT, ΔtolC, ΔacrB, ΔacrD, ΔacrF, ΔmdsB, ΔmdtC or ΔemrB Salmonella in WT Mφ normalized to values after 30 min internalization. p values are indicated (ANOVA with Dunnett’s correction for multiple testing against the WT); error bars depict means and standard deviation (SD); n = 4. DT: Detection Threshold. (D) Bacterial load of WT or ΔacrB Salmonella in WT Mφ after 30 min internalization (T0) and at 16 h of infection (T16) in the absence of antibiotics. p values are indicated (ANOVA with Tukey’s correction for multiple comparisons); error bars depict means and standard deviation (SD); n = 3. (E) (Left) Illustration of the experimental setup. After 24 h of cefotaxime exposure, infected macrophages containing non-growers (NG) were exposed to 26 h of cefotaxime or ciprofloxacin. To distinguish active (aNG) and inactive (iNG) non-growers, production of GFP was induced during 2 h prior extraction and analysis. (Right) Representative FACS plots and quantification of the level of transcriptional/translational activity in active and inactive cefotaxime or ciprofloxacine-treated intramacrophage WT or ΔacrB Salmonella in WT Mφ at 50 h of infection. p values are indicated (ANOVA with Tukey’s correction for multiple comparisons); error bars depict means and standard deviation (SD); n = 3.

