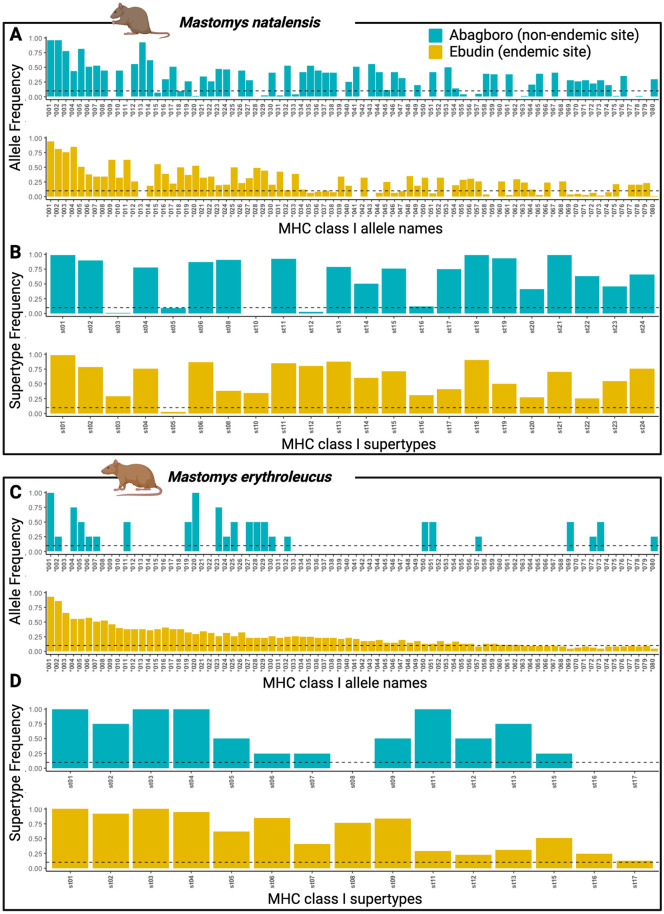
Fig 3. MHC-I allele and supertype distribution between Mastomys species and localities.
Alleles *001 to *080 are shown here. Rare alleles (labelled > *080) are displayed in S2 Appendix. Colours represent the distinct localities, Abagboro (in blue) is considered non-endemic for LASV, Ebudin (in yellow) is endemic for LASV. The dotted lines represent the minimum frequency threshold of alleles and supertypes to be included in the co-occurrence analyses.

