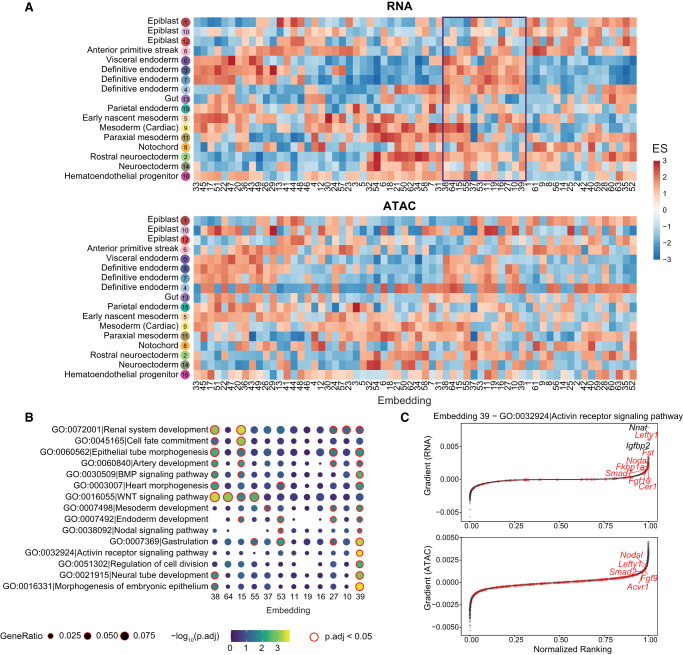
Figure 4.
Biological signals in the mESC data set captured by each embedding dimension of scTIE. (A) Enrichment scores of the gradient ranking in each embedding dimension using the RNA (top) and ATAC (bottom) marker list for each cell type. (B) Gene Ontology enrichment of selected pathways on the gradient ranking of a subset of embedding dimensions. (C) Gradient rankings for RNA (top) and ATAC (bottom) of embedding dimension 39, in which genes/peaks are ranked based on the gradient values. The labeled points are genes in the selected gene set (activin receptor signaling pathway).

