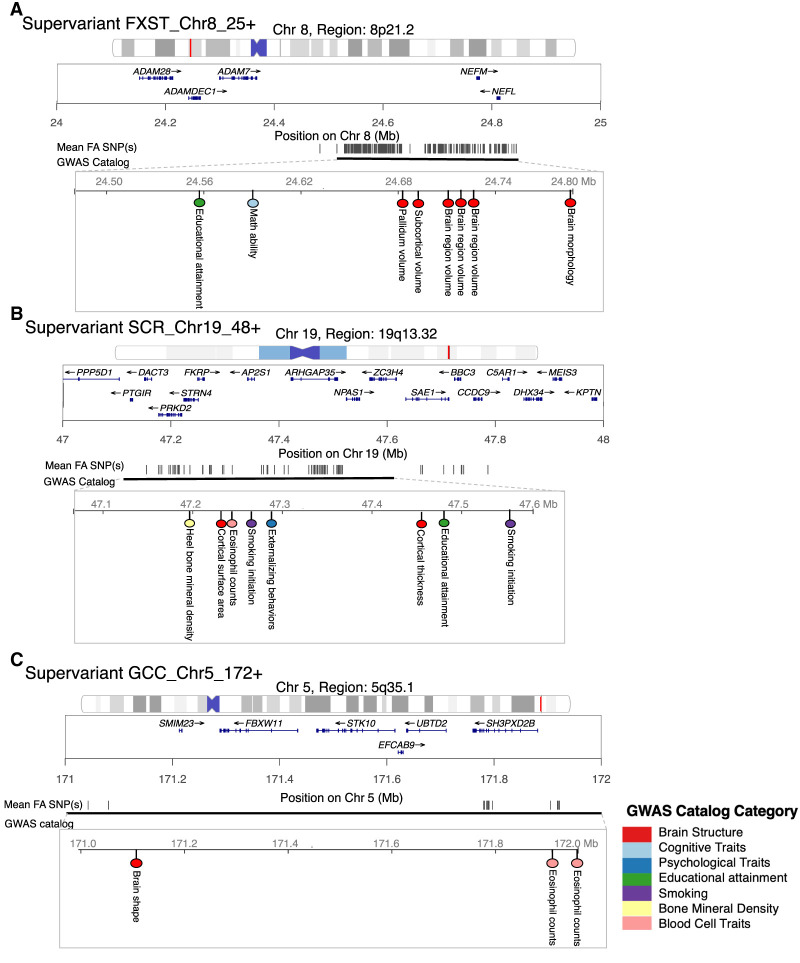
Figure 5.
Selected supervariants with shared genetic loci associated with other complex traits and disorders. (A) Supervariant FXST_Chr8_25+. (B) Supervariant SCR_Chr19_48+. (C) Supervariant GCC_Chr5_172+. Black lines represent the physical location of selected SNPs on the chromosome. Physical location of SNPs that have been associated with other complex traits in the NHGRI-EBI GWAS catalog are shown. Colors of dots represent different trait categories.

