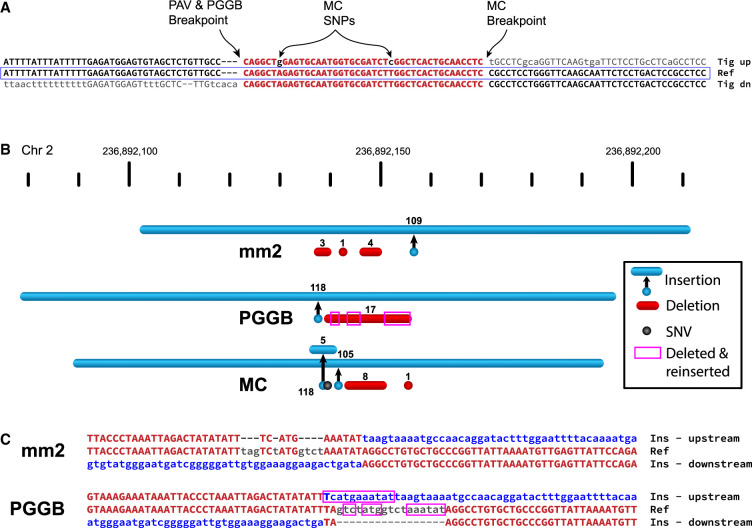
Figure 5.
Pangenome graph breakpoints show systematic bias. (A) A variant with a different breakpoint in the MC graph versus GRCh38, with the red portion showing the imperfect homology between breakpoint placements, resulting in two SNPs called in the MC graph in all HPRC haplotypes (A > G and T > C). (Tig up) Contig sequence spanning from reference to inserted sequence, (Tig dn) contig sequence spanning from insertion sequence to the reference, and (Ref) reference sequence at the site of the insertion. (B) An SV insertion (blue) paired with deleted bases (red) yields a 101-bp net gain by minimap2 (mm2, HGSVC callset), PGGB, and MC. minimap2 calls three small deletions near the insertion breakpoint. PGGB calls one larger deletion but reinserts deleted bases (magenta boxes) into the insertion call, resulting in a larger SV insertion than minimap2. MC calls two insertions, two deletions, and a mismatch (black dot). (C) Alignments through breakpoints are shown for minimap2 and PGGB. Bases aligned to the reference are shown in red with matches in uppercase; inserted sequences are blue; and deleted bases are gray. The inserted sequence was not found in GRCh38 but was present in nonhuman primates and likely represents the deletion of ancestral sequence where the reference contains the derived (deleted) allele.

