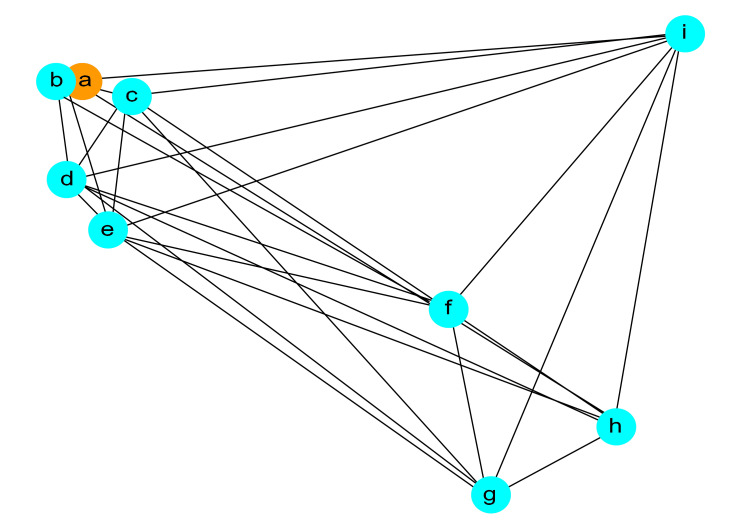
Figure 1. Network Analysis of High Post-Void Residual (PVR) Risk Factors in Overactive Bladder (OAB) Treatment.
The network graph depicted in this figure visually represents the correlation relationships between selected variables. In this network graph, there are no x or y axes; the nodes (points) represent variables, and the edges (lines) indicate the correlation relationships between these variables. This visualization provides an intuitive means to understand the relationships between variables.
Node a: PVR, b: 72h-nocturia episodes, c: FRAILTY, d: 72hr-daytime frequency, e: logit(p), f: bladder contractility index, g: OAB-wet, h: cytometric bladder capacity, i: voiding efficiency.
Edges: Representing correlation relationships between variables.

