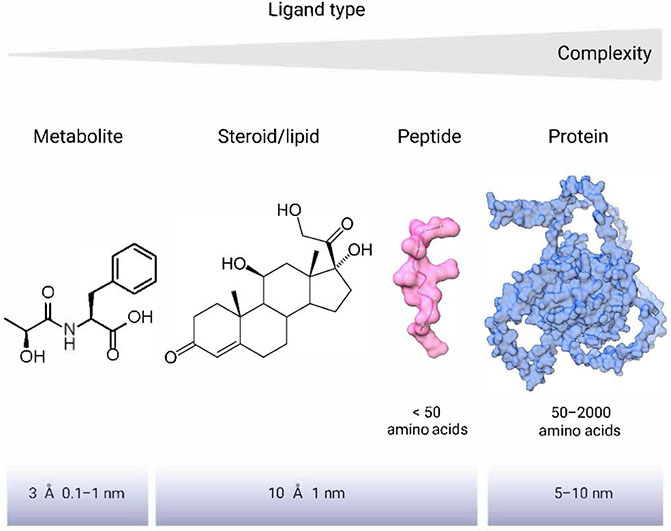
Figure 1.
Structures and complexities of selected ligand types. The figure illustrates a spectrum of molecular complexities and sizes, displaying from right to left. On the far right, the structure of the secreted protein ISM-1 is shown, representing the larger and more complex end of the spectrum. Moving leftward, the structure of an 11-mer peptide is depicted, which is smaller and less complex than proteins. Further left, the structure of cortisol represents a middle-of-the-range molecule in terms of size and complexity. On the far left, the structure of Lac-Phe is presented, highlighting a relatively simple metabolite. The diversity in size, complexity, and formation of each structure underscores the sophisticated nature of intercellular and inter-organ communication.

