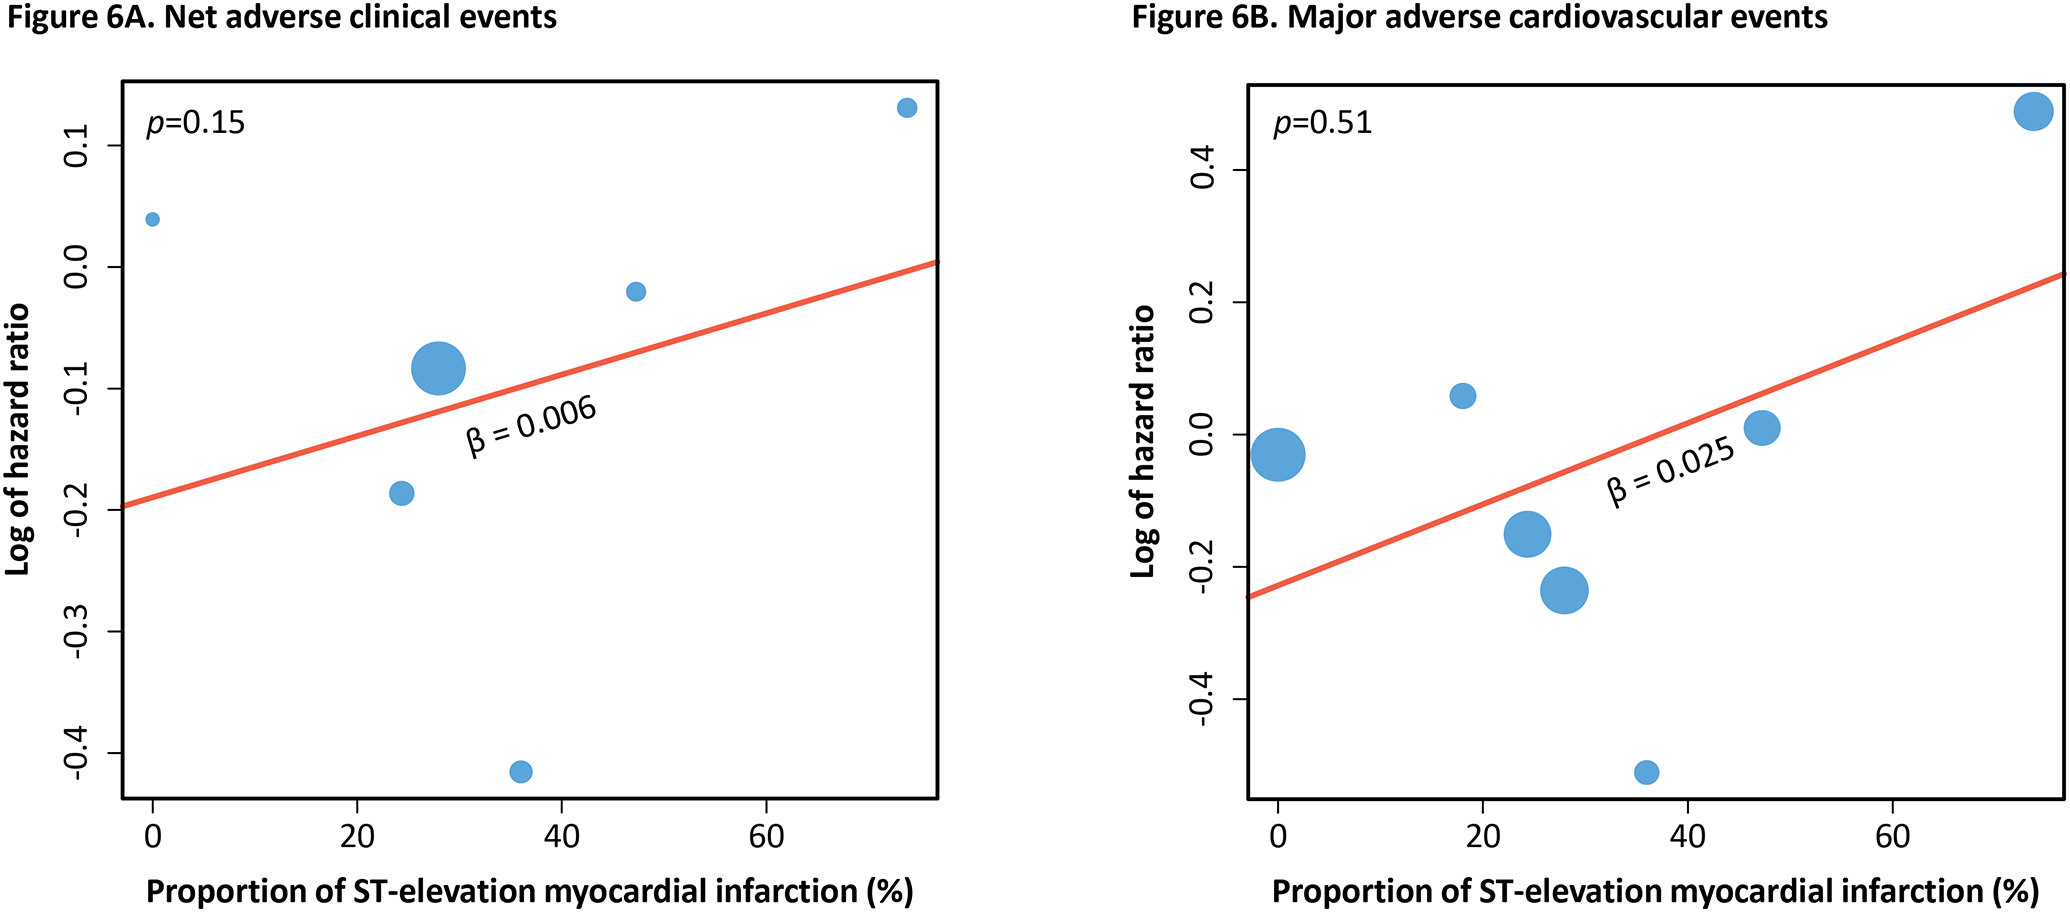
Figure 6. Meta-regression of primary outcomes to proportion of ST-elevation myocardial infarction.

The two graphs above show the association of the hazard ratio of net adverse clinical events (Figure 6A) and major adverse cardiovascular events (Figure 6B) with the proportion of ST-elevation myocardial infarction included in the trials. Positive beta coefficient signifies positive correlation and vice versa. P-value of the trend is shown in the top left corner of each graph.
