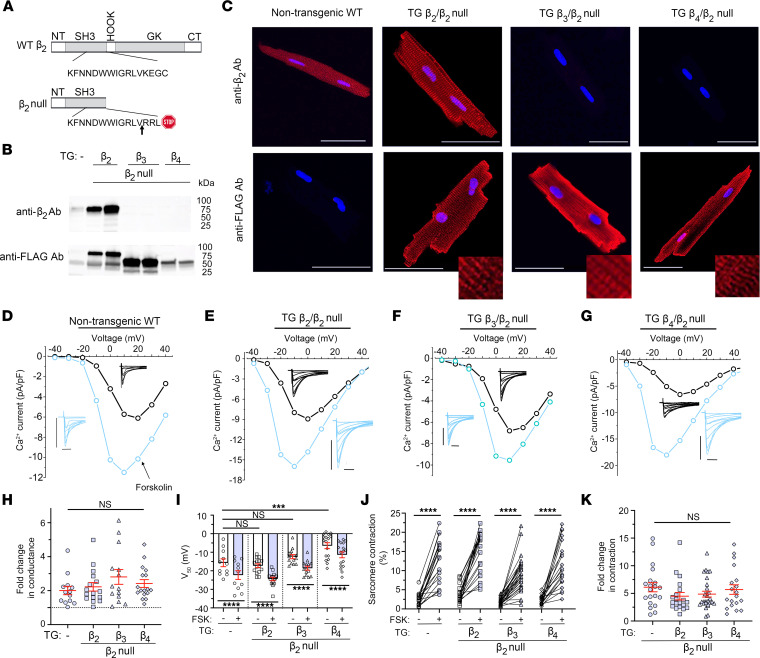
Figure 1. Extent of adrenergic regulation of Ca2+ channels is independent of a specific of CaVβ subunit isoform.
(A) Schematic depicting CaVβ domains. NT, N-terminus; CT, C-terminus; Src homology 3 (SH3) domain, a conserved guanylate kinase (GK) domain, and a variable and flexible HOOK region that connects them. In β2-null mice, a frame-shift insertion causes an early termination at the end of the SH3 domain. (B) Anti-β2 and anti-FLAG immunoblots. (C) Anti-FLAG and anti-β2 immunofluorescence of nontransgenic WT and transgenic (TG) FLAG-β–expressing cardiomyocytes. Nuclear staining with DAPI. Scale bars: 50 μm. Representative of 3 similar experiments. Insets, ×4 enlargement to show striated pattern of expression. (D–G) Exemplar current-voltage relationships of Ca2+ channels in the absence (black trace) and presence of forskolin (blue trace). Insets: Exemplar whole-cell CaV1.2 currents. Pulses from –60 mV to +10 mV before (black traces) and 3 minutes after (blue traces) forskolin. Horizontal scale bars = 50 ms, vertical scale bars = 10 pA/pF. (H) Fold change at –20 mV in peak current caused by forskolin (FSK). Mean ± SEM. P = not significant (NS) by 1-way ANOVA; n = 13, 16, 14, and 17 cardiomyocytes from 7, 3, 4, and 6 mice. TG, transgenic. (I) Boltzmann function parameter, V50, before and after FSK. Mean ± SEM. Statistical analysis among non-TG, β2, β3, and β4: P < 0.0001 by 1-way ANOVA; ***P < 0.001 by Šidák’s multiple-comparison test. Statistical analysis of no FSK versus FSK: ****P < 0.0001 by paired, 2-tailed t test. (J) Field stimulation–induced change in sarcomere contraction. ****P < 0.0001 by paired, 2-tailed t test. (K) Forskolin-induced fold change in sarcomere length. Mean ± SEM. n = 20, 20, 28, and 19 from 3, 3, 3, and 3 mice, from left to right. P = not significant by 1-way ANOVA.

