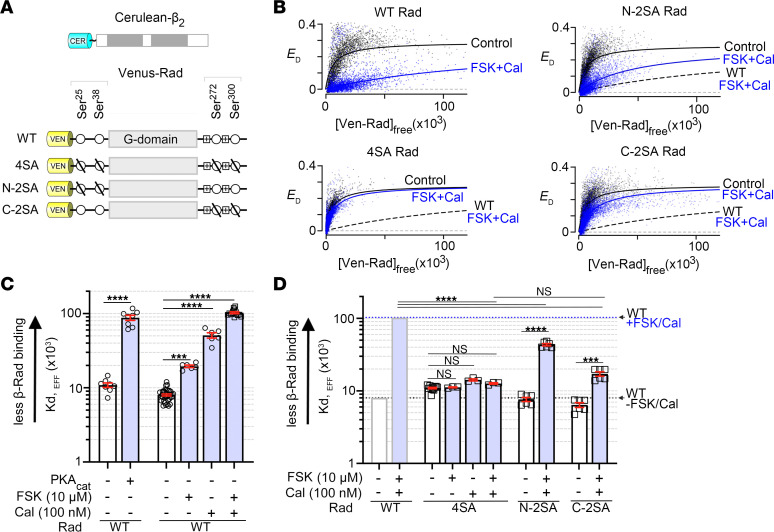
Figure 2. Effects of phosphorylation of Venus-Rad on its binding to Cerulean-β2B, as monitored by FRET.
(A) Schematics of the FRET pairs, Cerulean (Cer)-β2B with Venus (Ven)-WT Rad, and Ven-4SA, Ven-N-2SA, and Ven-C-2SA Rad. Small circles are phosphorylation sites. 4SA: Ala substitutions of Ser25, Ser38, Ser272, and Ser300; N-2SA: Ala substitutions of Ser25 and Ser38; C-2SA: Ala substitutions of Ser272 and Ser300. (B) FRET efficiency (ED) between Ven-conjugated WT or Ven-conjugated mutant Rad and Cer-β2B is plotted against the free concentration of Ven-Rad, in the absence (control, black) and the presence (blue) of 10 μM forskolin (FSK) and 100 nM calyculin A (Cal). The 1:1 binding isotherms are fit to the data (solid lines). The dashed lines are fits to the data from FSK/Cal–treated WT Rad cells. (C and D) Graphs summarizing mean Kd,EFF for the binding of β2B and WT Rad, 4SA Rad, N-2SA Rad, and C-2SA Rad, in absence and presence of PKAcat, FSK, and Cal. Error bars are SEM. The significance of the differences versus no treatment are P < 0.0001 by 1-way ANOVA; ***P < 0.001, ****P < 0.0001 by Šidák’s multiple-comparison test. For C, n = 8, 8, 36, 6, 6, and 14 from left to right. For D, WT data are same as C, starting at 4SA Rad: n = 12, 3, 3, 3, 6, 6, 6, and 6 from left to right.

