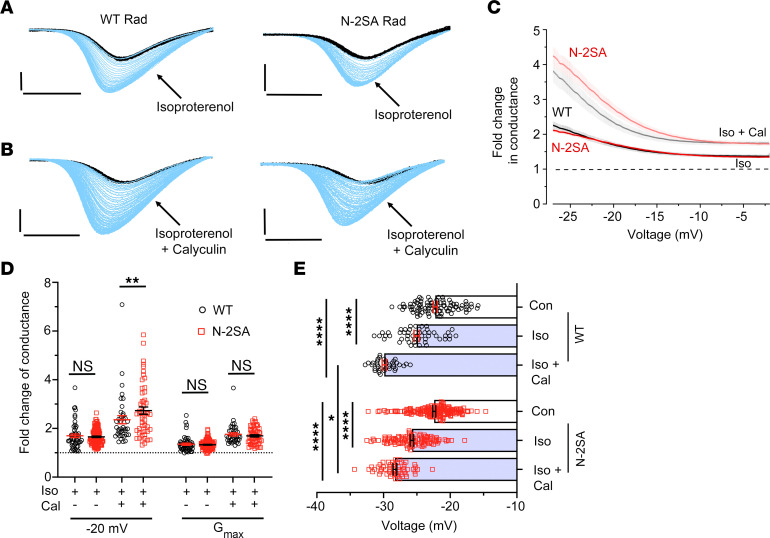
Figure 3. Effects in ventricular cardiomyocytes of removing sites for PKA phosphorylation from the Rad NTD on β-adrenergic agonist augmentation of CaV1.2 currents.
(A and B) Ba2+ currents elicited by voltage ramp every 3 seconds in WT and N-2SA Rad ventricular myocytes, with black traces obtained before and blue traces obtained after isoproterenol or isoproterenol plus calyculin A. Scale bars: 3 pA/pF (vertical) and 50 ms (horizontal). (C) Graph of fold change in Ba2+ conductance after isoproterenol (Iso) or isoproterenol plus calyculin (Iso + Cal) to Ba2+ conductance before treatment versus voltage of cardiomyocytes isolated from WT and N-2SA Rad mice. Mean ± SEM. For isoproterenol: WT: 51 cells, 7 mice, N-2SA: 112 cells, 11 mice; for calyculin: WT: 38 cells, 3 mice, N-2SA: 43 cells, 5 mice. (D) Fold change in peak current at –20 mV and Gmax. Mean ± SEM. Same sample size as in C. P < 0.0001 by 1-way ANOVA; **P < 0.001 by Šidák’s multiple-comparison test. (E) Boltzmann’s function parameter, V50, before and after isoproterenol, or isoproterenol and calyculin A. P < 0.0001 by 1-way ANOVA; *P < 0.05, ****P < 0.0001 by Šidák’s multiple-comparison test.

