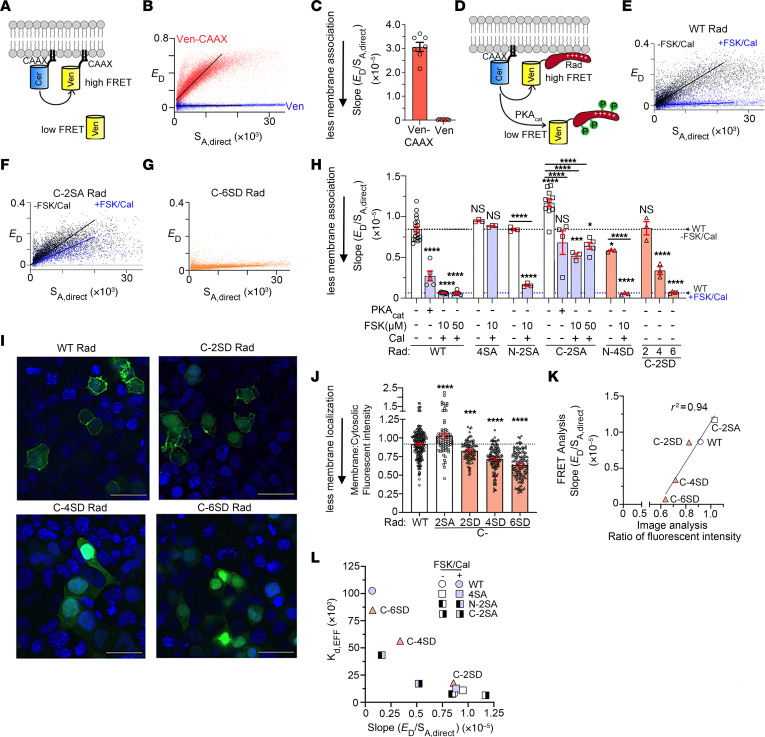
Figure 5. Effects on Venus-Rad binding to the membrane of phosphorylation and insertion of negatively charged Asp residues.
(A) FRET biosensor for membrane binding. Cerulean and Venus fluorescent proteins were conjugated with CAAX. (B) FRET efficiency (ED) is plotted against SA,direct, the fluorescence intensity of the acceptor (Venus), directly excited. Lines are linear slope using least-squares fit. (C) Slope of ED between Cer-CAAX and Ven-CAAX or Ven alone. Mean ± SEM. ****P < 0.0001 by 2-tailed, unpaired t test. n = 7. (D) Shown are Cer-CAAX and WT Rad or mutant Rad conjugated to the Venus fluorescent protein. High FRET signal is detected when both proteins are colocalized at the membrane. (E) ED is plotted against SA,direct of Ven-WT Rad, either untreated or treated with 10 μM forskolin plus 100 nM calyculin A. (F) As in E, with C-2SA Rad. (G) As in E, with C-6SD Rad. (H) FRET binding studies of Ven-conjugated proteins to membrane. Mean ± SEM. Statistics for comparison to control column (WT without PKA, FSK or Cal). P < 0.0001 by 1-way ANOVA; *P < 0.05, ***P < 0.001, ****P < 0.0001 by Dunnett’s test. n = 20, 5, 9, 6, 3, 3, 3, 3, 11, 4, 3, 5, 3, 3, and 4 from left to right. (I) Fluorescence of GFP-tagged WT and mutant Rad expressed in HEK293 cells. Nuclear staining with DAPI. Scale bars: 32 μm. (J) Ratio of membrane and cytosolic fluorescence intensities for WT and mutant Rad protein. Mean ± SEM. P < 0.0001 by 1-way ANOVA; ***P < 0.001, ****P < 0.0001 by Šidák’s test compared with WT Rad. n = 223, 84, 103, 135, and 143 cells from left to right. (K) Relationship between fluorescence image analysis and FRET analysis. Line was fit by linear regression. (L) Correlation between Rad membrane association and β-Rad binding without and with 10 μM forskolin and 100 nM calyculin for WT Rad and Rad mutants 4SA, N-2SA, C-2SA, C-2SD, C-4SD, and C-6SD.

