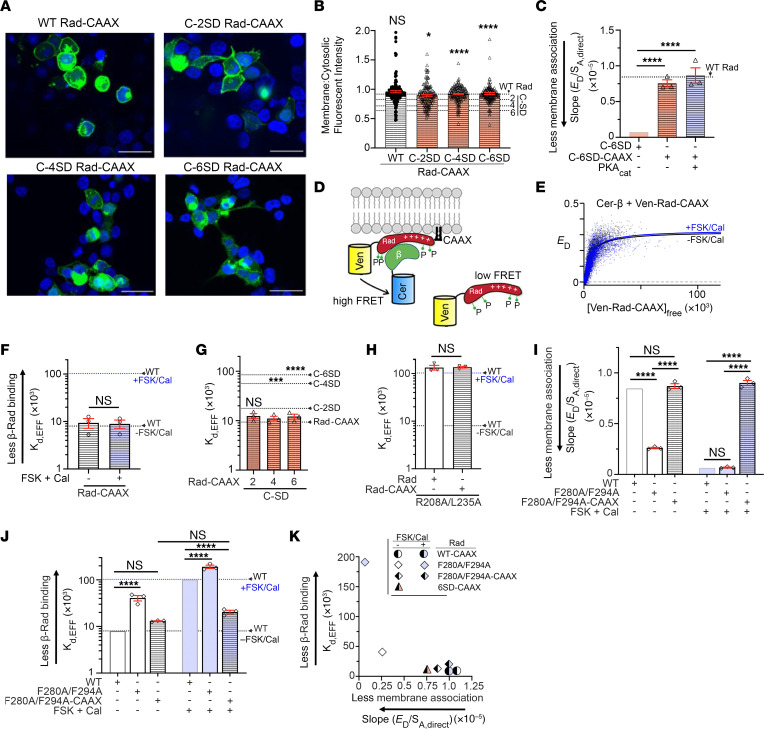
Figure 6. Effects of tethering of Rad to the plasma membrane via CAAX motif.
(A) Fluorescence of GFP-tagged WT and mutant Rad-CAAX proteins. Nuclear staining with DAPI. Scale bars: 32 μm. (B) Ratio of membrane and cytosolic fluorescence intensities. Mean ± SEM. Dashed lines are mean values of WT Rad, and C-2SD, C-4SD, and C-6SD (from Figure 5). Statistical comparisons to non–CAAX-conjugated constructs. P < 0.0001 by 1-way ANOVA; *P < 0.05, ****P < 0.0001 by Šidák’s test. n = 183, 167, 180, and 175 cells from left to right. (C) FRET binding studies of Ven-conjugated C-6SD proteins to membrane. C-6SD bar is same as in Figure 5H. Dotted line is value for WT Rad (from Figure 5H). Mean ± SEM. P < 0.0001 by 1-way ANOVA; ****P < 0.0001 by Dunnett’s test. n = 4, 3, and 3 from left to right. (D) Schematic of Cer-β and Ven-Rad-CAAX. (E) FRET efficiency between Ven-Rad-CAAX and Cer-β is plotted against the total concentration of Ven-Rad-CAAX. (F) Mean Kd,EFF for binding of Rad-CAAX to β. Error bars are SEM. Differences not significant by 2-tailed, unpaired t test. n = 3 and 3 from left to right. (G) Mean Kd,EFF for binding of CAAX-conjugated mutant Rad proteins to β. Error bars are SEM. Statistical comparisons to non–CAAX-conjugated constructs. P < 0.0001 by 1-way ANOVA; ***P < 0.001, ****P < 0.0001 by Šidák’s test. (H) Mean Kd,EFF for binding of β to R208A/L235A Rad or R208A/L235A-CAAX Rad. Differences are not significant by 2-tailed, unpaired t test. (I) As in C, with F280A/F294A. WT and WT + FSK/Cal are the same data as in Figure 5H. Error bars are SEM. P < 0.0001 by 1-way ANOVA; ****P < 0.0001 by Šidák’s test. n = 20, 3, 3, 9, 3, and 3 from left to right. (J) Mean Kd,EFF for binding of β to F280A/F294A Rad or F280A/F294A-CAAX Rad. Error bars are SEM. P < 0.0001 by 1-way ANOVA; ****P < 0.0001 by Šidák’s test. n = 36, 3, 3, 14, 3, and 3. (K) Correlation between Rad membrane association and β-Rad binding.

