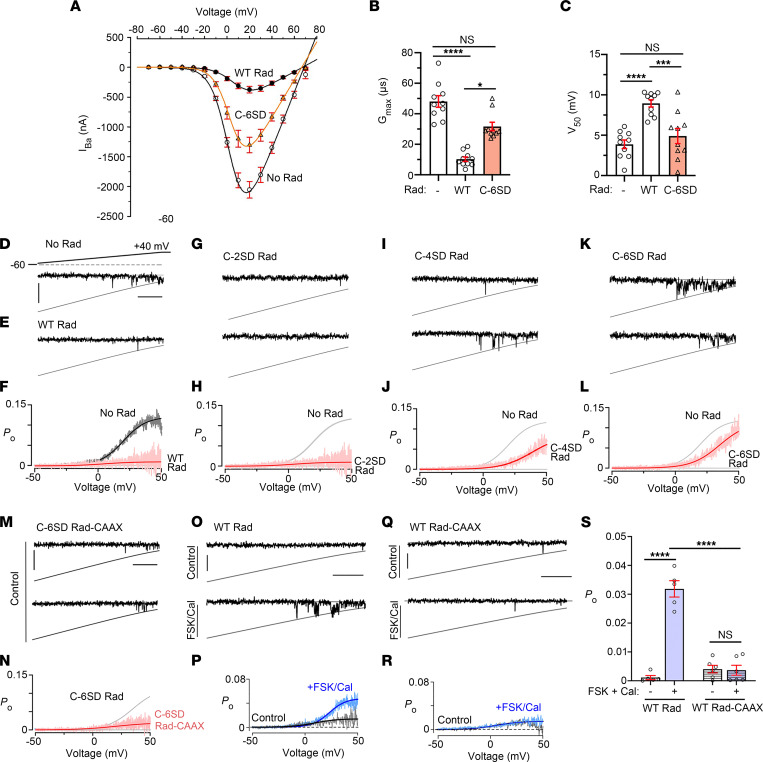
Figure 7. Effects of insertion of negatively charged Asp residues or CAAX in C-terminus of Rad on electrophysiological properties of CaV1.2 channels.
(A) Current-voltage (I-V) curves of Ba2+ currents (IBa) in oocytes expressing α1C, β2B, α2δ, and no Rad, WT Rad, or C-6SD Rad. Net IBa values (mean ± SEM), obtained after subtraction of current in the presence of Cd2+, are shown. The solid lines are I-V curves drawn with the Boltzmann equation (see Supplemental Table 1). (B) Graph of whole-cell maximal Ba2+ conductance, Gmax. Bars show mean ± SEM. n = 10 oocytes in each group. P < 0.0001 by Kruskal-Wallis test; *P < 0.05, ****P < 0.0001 by Dunn’s multiple-comparison test. (C) Graph of V50, P < 0.0001 by 1-way ANOVA; ***P < 0.001, ****P < 0.0001 by Tukey’s multiple-comparison test. NS, P > 0.05. (D, E, G, I, and K) Single-channel Ba2+ currents are shown. Openings are downward deflections to the open level (slanted gray curves). Horizontal bar = 25 ms; vertical bar = 1 pA. (F, H, J, and L) Mean Po versus voltage relationship. n = 5 for all groups. Black and red lines are Boltzmann fits. (M) Single-channel Ba2+ currents for CaV1.2 channels coexpressed with C-6SD-CAAX Rad. (N) Mean PO versus voltage relationship. n = 5 cells. Solid lines are Boltzmann fits. Horizontal bar = 25 ms; vertical bar = 1 pA. (O and Q) Single-channel Ba2+ currents are shown for CaV1.2 channels coexpressed with WT Rad or WT Rad-CAAX in the absence or presence of FSK and Cal preincubated for 5 minutes. Horizontal bar = 25 ms; vertical bar = 1 pA. (P and R) Mean PO versus voltage relationship. n = 5 cells. Solid lines are Boltzmann fits. (S) Graph of PO for single-channel data in O and Q. Mean ± SEM. P < 0.0001 by 1-way ANOVA; ****P < 0.0001 by Tukey’s multiple-comparison test.

