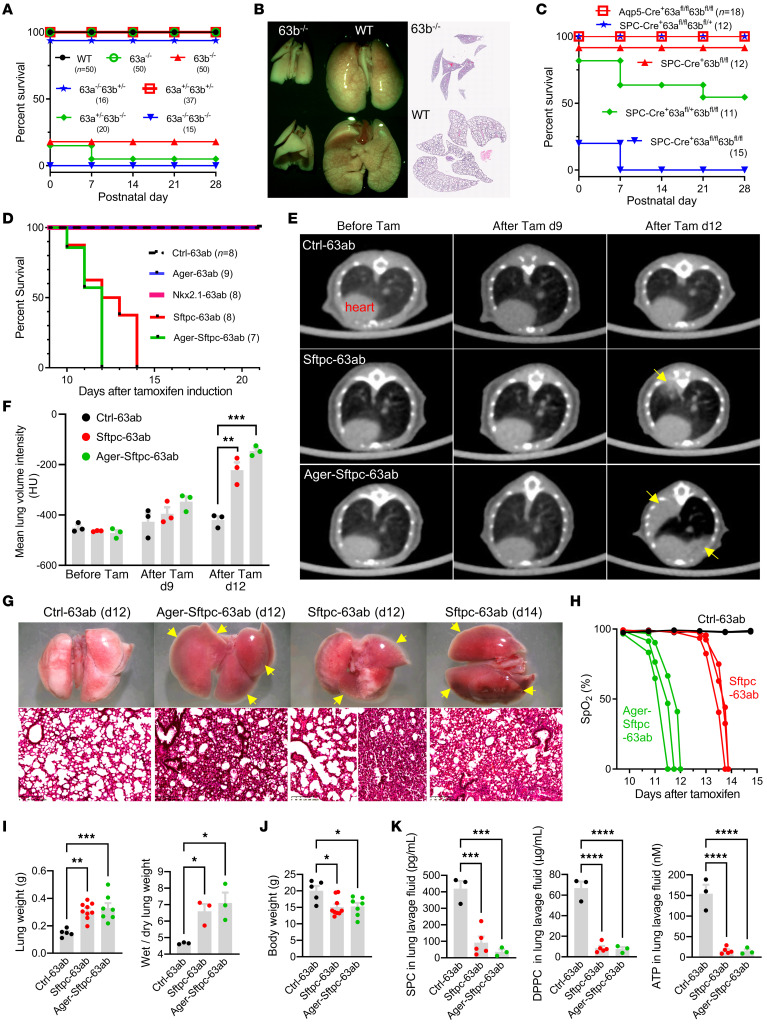
Figure 4. Lethal pulmonary phenotypes of Tmem63a/b-KO mice.
(A) Survival curves for constitutive Tmem63a/b-KO mice of different genotypes. The numbers of mice are shown in parentheses. (B) Failure of alveolar expansion in Tmem63b-KO mice after birth (P0). Original magnification, ×2. (C) Survival curves of AEC-specific Tmem63a/b conditional-KO mice with different genotypes. Aqp5-Cre was expressed in AT1 cells and approximately 50% of AT2 cells SPC-Cre was expressed in all AT2 cells. (D) Survival curves for tamoxifen-inducible, AEC-specific Tmem63a/b-cDKO mice. Ager-CreERT2 was expressed in AT1 cells and approximately 10% of AT2 cells; Nkx2.1-CreERT2 was expressed in AT1 cells and approximately 80% of AT2 cells; and Sftpc-CreERT2 was expressed in all AT2 cells. Ctrl-63ab represents 63afl/fl 63bfl/fl mice without Cre, and others are with the corresponding CreERT2. (E) Micro-CT images of mouse lungs after tamoxifen induction. Arrows indicate regions of atelectasis. (F) Mean lung volume intensities for mice before and after tamoxifen induction, measured from the micro-CT images. n = 3 mice. (G) Atelectasis in cDKO mice illustrated by freshly dissected lungs and H&E-stained sections. Arrows indicate collapsed lobes. Scale bars: 200 μm. (H) A dramatic decline of SpO2 before respiratory failure was observed in cDKO mice. n = 3 mice. (I) Characteristics of pulmonary edema in cDKO mice at post-tamoxifen day 12. n = 5, 9, and 7 mice for lung weight from left to right; n = 3 mice for wet/dry ratio. (J) Body weights in cDKO mice at post-tamoxifen day 12. n = 5, 9, and 7 mice from left to right. (K) Deficiency of secreted SPC, surfactant phospholipid DPPC, and ATP in BALF collected from cDKO mice at post-tamoxifen day 10. n = 3, 5, and 3 mice from left to right in each graph. *P < 0.05, **P < 0.01, ***P < 0.001, and ****P < 0.0001, by 1-way ANOVA with Tukey’s test.

