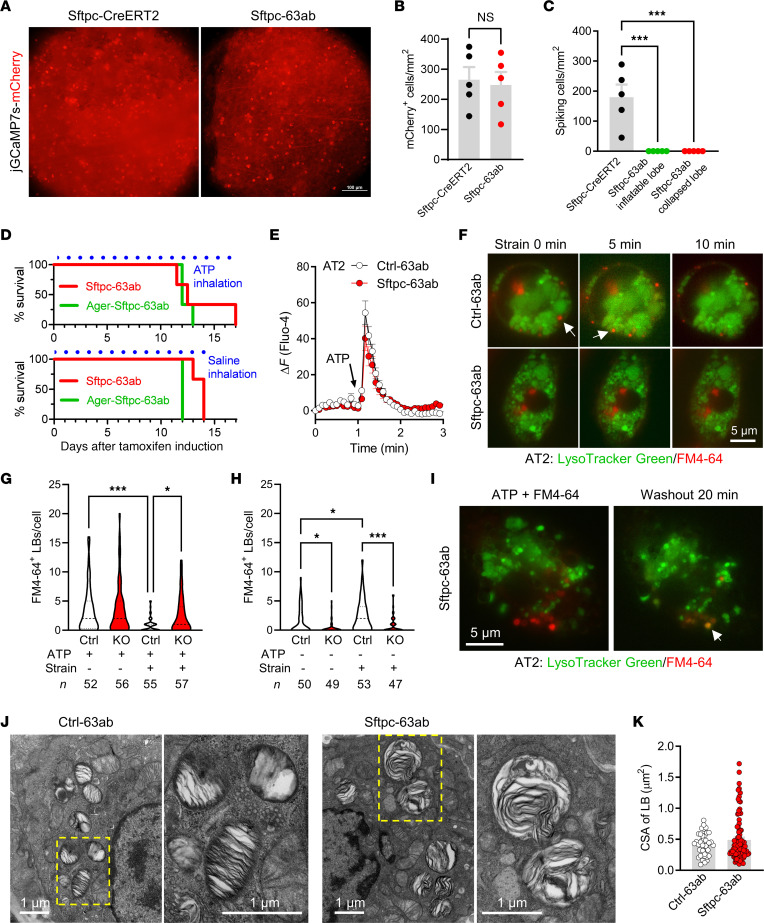
Figure 5. Deficiency of TMEM63A/B abolishes ventilation-induced Ca2+ transients and surfactant release in AT2 cells.
(A) mCherry fluorescence in AAV-infected (CAG-DIO-jGCaMP7s-mCherry–infected) lungs showing positively transduced AT2 cells (brighter spots). Sftpc-63ab represents Sftpc-CreERT2+/– 63afl/fl 63bfl/fl. Scale bar: 100 μm. (B) The densities of positively transduced AT2 cells were comparable between the control Sftpc-CreERT2 and Sftpc-63ab mice. n = 5 lung lobes. NS, nonsignificant, by 2-tailed, unpaired Student’s t test. (C) Lung inflation–induced Ca2+ transients in AT2 cells were completely abolished in all lung lobes from Sftpc-63ab mice, as revealed by jGCaMP7s fluorescence. n = 5 lung lobes. ***P < 0.001, by 1-way ANOVA with Tukey’s test. (D) Survival curves for Tmem63a/b-cDKO mice that received daily inhalation (30 min each time, 3 times/day) of aerosolized ATP (200 mM) or saline solution after tamoxifen induction. n = 3 mice. (E) ATP-induced Ca2+ response in primary AT2 cells isolated from Ctrl-63ab (63afl/fl 63bfl/fl) and Sftpc-63ab mice (n = 30 and 35 cells, respectively). (F) Cell strain–induced surfactant release occurred in AT2 cells from Ctrl-63ab, but not Sftpc-63ab, mice. Unfused LBs were stained by LysoTracker Green; LBs fused on the plasma membrane were positive for FM4-64. Arrows indicate LBs that released surfactant (FM4-64 fluorescence disappeared after strain). Scale bar: 5 μm. (G and H) Tmem63a/b-cDKO did not affect ATP-induced LB fusion but significantly attenuated cell strain–induced surfactant release. Ctrl, Ctrl-63ab; KO, Sftpc-63ab. The median and quartiles are shown by dashed and dotted lines, respectively. The numbers of cells are shown at the bottom. *P < 0.05 and ***P < 0.001, by 1-way ANOVA with Tukey’s test. (I) Reacidification of LBs after removal of ATP in AT2 cells from Sftpc-63ab mice. Overlapped LysoTracker Green and FM4-64 fluorescence (orange, indicated by the arrow) suggests that the fusion pore was closed and luminal pH was reacidified. Scale bar: 5 μm. (J and K) Transmission electron microscopy images and cross-sectional areas (CSAs) of LBs from Ctrl-63ab and Sftpc-63ab mice. n = 41 and 94 LBs, respectively. Scale bars: 1 μm.

