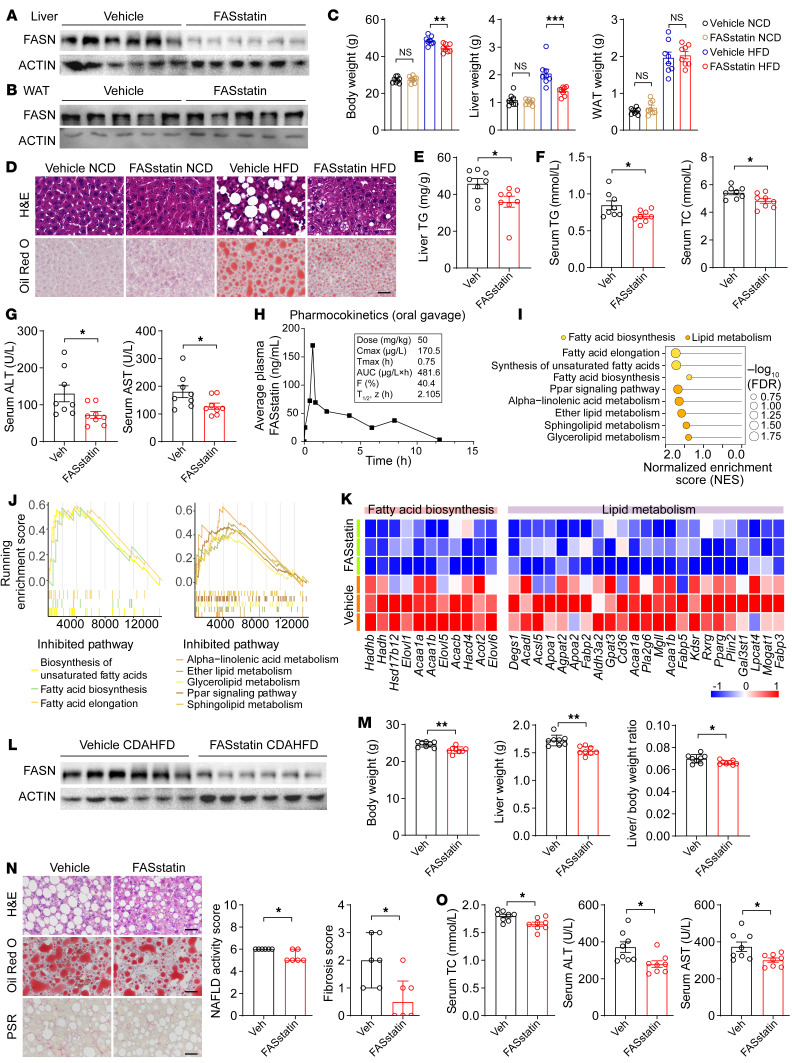
Figure 9. FASstatin protects against NAFLD and NASH with good safety and oral bioavailability.
(A and B) The NAFLD model was established by feeding male C57BL/6J mice a HFD for 16 weeks. Thereafter, mice were orally administered vehicle or FASstatin (50 mg/kg/d) for an additional 8 weeks, concurrently with HFD feeding. FASN protein expression in livers and white adipose tissue (WAT) of NAFLD mice treated with vehicle or FASstatinin 2 groups of mice (n = 5–6, 6). (B) Western blot analysis of FASN protein expression in WAT of NAFLD mice treated with vehicle or FASstatin as described in A (n = 5). (C) Body weight, liver weight, and WAT weight of mice as described in A (n = 8). One-way ANOVA followed by Bonferroni’s post hoc test. (D) Representative images of H&E-stained (top) and Oil Red O–stained staining(bottom) of liver sections from 2 groups of miceNCD- or HFD-fed mice treated with vehicle or FASstatin for 8 weeks (n = 6). Scale bars: 50 μm. (E) TG content per gram of liver from the indicated groups of mice fed a HFDdetermination (n = 8). Two-tailed Student’s t test. (F) Serum levels of TG and TC in vehicle- and FASstatin-treated mice (n = 8). Two-tailed Student’s t test. (G) Serum levels of ALT and AST in vehicle- and FASstatin-treated mice (n = 8). Two-tailed Student’s t test. (H) Pharmacokinetic characterization of FASstatin in the plasma of C57BL/6J mice after a single dose of FASstatin administered via oral gavage (50 mg/kg). Plasma was harvested at the indicated time point, and the concentration-time curve (T1/2) was plotted (n = 3). The bioavailability factor (F) was calculated. (I) Pathway enrichment analysis of liver tissues from vehicle- or FASstatin-treated mice fed a HFD (n = 3). (J) GSEA analysis of the indicated pathways (n = 3). (K) Heatmap analysis of differentially expressed genes in liver tissues from HFD mice treated with vehicle or FASstatin (n = 3). (L) Effect of FASstatin on FASN protein expression in liver tissues from mice fed a CDAHFD (n = 6). Male C57BL/6J mice were fed a CDAHFD for 2 weeks before treatment with vehicle or FASstatin (50 mg/kg/d, i.g.) for an additional 4 weeks. (M) Effect of FASstatin on liver weight, body weight and the liver weight/body weight ratio in mice fed a CDAHFD as described in L (n = 8). Two-tailed Student’s t test. (N) Effect of FASstatin on liver pathology (H&E staining), hepatic steatosis (Oil Red O staining), and fibrogenesis (Picrosirius red staining of vehicle- and FASstatin-treated NASH mice). NAS and fibrosis score was calculated (n = 6). Scale bars: 50 μm. Mann-Whitney U test. (O) Effect of FASstatin on serum TC, ALT, and AST levels (n = 8). Two-tailed Student’s t test (E–G, M, and O). *P < 0.05, **P < 0.01, and ***P < 0.001 (C, E–G, and M–O).

