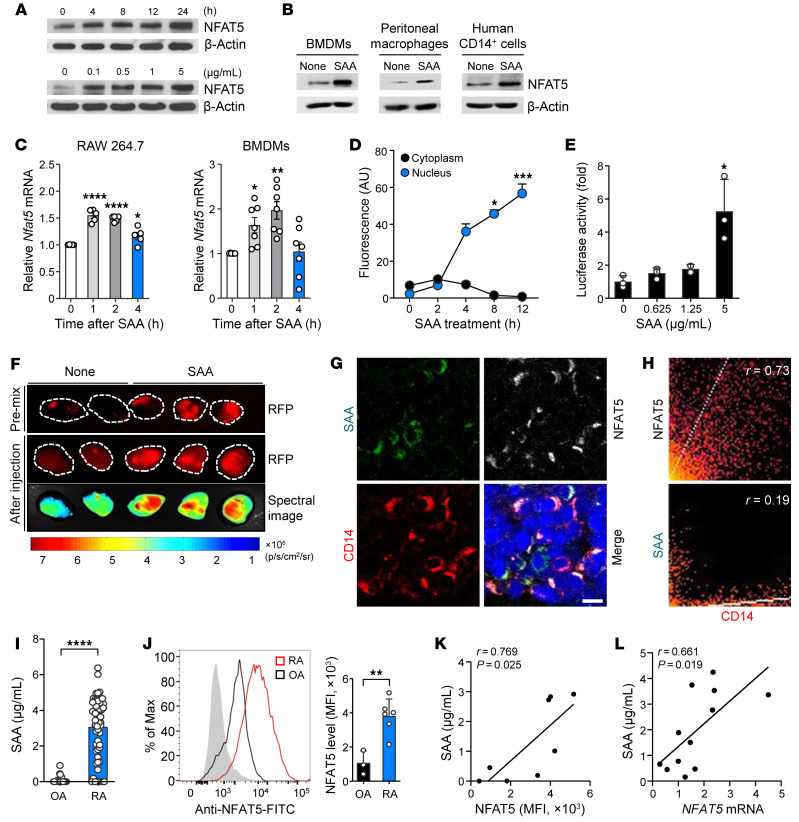
Figure 1. SAA-induced upregulation of NFAT5 expression and activity in macrophages.
(A and B) Western blot analysis of NFAT5 in (A) RAW 264.7 macrophages, (B) primary mouse macrophages (BMDMs, left; peritoneal macrophages, middle) and human peripheral CD14+ monocytes (right) after SAA (5 μg/mL) treatment. β-actin served as a loading control. Data are representative of at least 3 independent experiments. (C) Nfat5 mRNA expression levels in RAW264.7 cells and BMDMs after treatment with SAA (5 μg/mL). For qRT-PCR, Gapdh mRNA was used as an internal control. (D) Time course of NFAT5 localization in RAW 264.7 macrophages (n = 5) treated with SAA. NFAT5 expression was determined by immunoflorescent staining and is shown as fluorescence intensity. (E) Luciferase reporter assays for NFAT5-dependent promotor activity in RAW 264.7 macrophages treated with SAA for 24 hours after transduction of luciferase constructs (n = 3). (F) In vivo analysis of NFAT5 reporter activity in mice implanted with matrigel containing RAW 264.7 macrophages transfected with NFAT5-RFP reporter. SAA (10 μg/mL) was premixed (top) with matrigel or injected s.c. into the mice (middle and bottom). Representative images are shown. (G and H) Triple immunofluorescence staining of RA synovium for CD14 (red), NFAT5 (white), and SAA (green). Nuclei were counterstained with DAPI (blue). Scale bars: 10 μm. Data representative of more than 3 patients with RA is shown (G). Significance of colocalization was assessed by Pearson’s correlation coefficient analysis (H). (I) SAA concentrations in synovial fluids (SF) of patients with RA (n = 60) and OA (n = 33), as determined by ELISA. (J) Flow cytometry analysis of NFAT5 expression in CD14+ cells freshly isolated from the SF of patients with RA (n = 6) and OA (n = 3). (K and L) Correlation between SAA concentrations measured by ELISA and NFAT5 expression levels in CD14+ cells by flow cytometry (K) or qRT-PCR (L) in SF of patients with RA. Data in (C–E, and J) are mean ± SD. *P < 0.05, **P < 0.01, ***P < 0.001, and ****P < 0.0001 by 1-way ANOVA with Dunn’s multiple comparisons test (C), Friedman’s test with Dunn’s multiple comparisons test (D), Kruskal-Wallis test with Dunn’s multiple comparisons test (E), Mann Whitney U test (I), unpaired t test (J), and Pearson correlation test (K and L).

