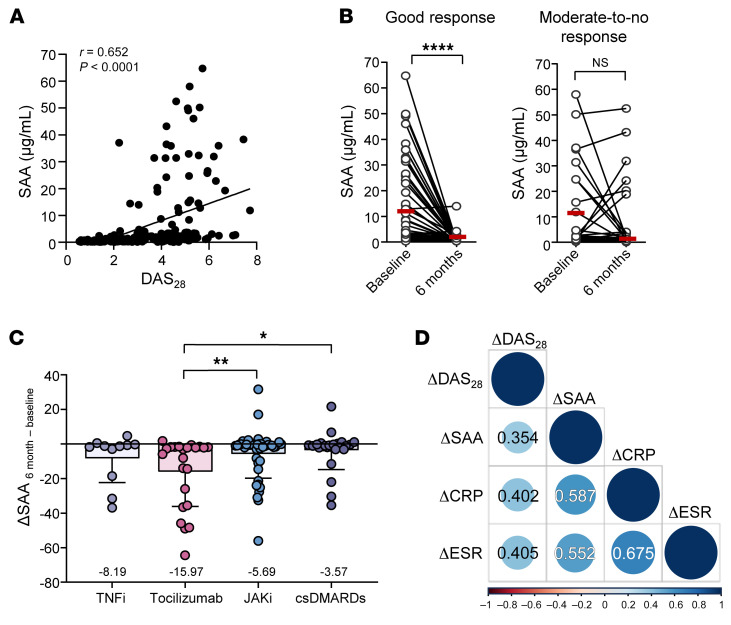
Figure 10. Serial monitoring of serum SAA levels before and after treatment with antirheumatic drugs in patients with RA.
(A) Correlation between SAA level and disease activity of RA. Serum SAA levels were measured by ELISA both before and 6 months after treatment with antirheumatic drugs, including TNFi, Tocilizumab, an anti-IL-6 receptor Ab, JAKi, and conventional synthetic disease-modifying antirheumatic drugs (csDMARDs) (See Supplemental Table 1 for more details). At the time of blood sampling, the DAS28, which represents RA activity, was assessed. The correlation analysis was performed using the Spearman test. (B) The ΔSAA from baseline to 6-month follow-up according to the treatment response. Good, moderate, and no response were defined according to EULAR response criteria. ****P < 0.0001 by Wilcoxon matched pairs signed rank test. (C) Comparison of ΔSAA levels depending on the kinds of antirheumatic drugs, including TNFi, Tocilizumab, JAKi, and csDMARDs. Data are mean ± SD. *P < 0.05 and **P < 0.01, by Kruskal-Wallis test with Dunn’s multiple comparisons test. (D) Positive correlations of ΔSAA with ΔCRP, ΔESR, and ΔDAS28. The correlation analysis was performed using the Spearman test.

