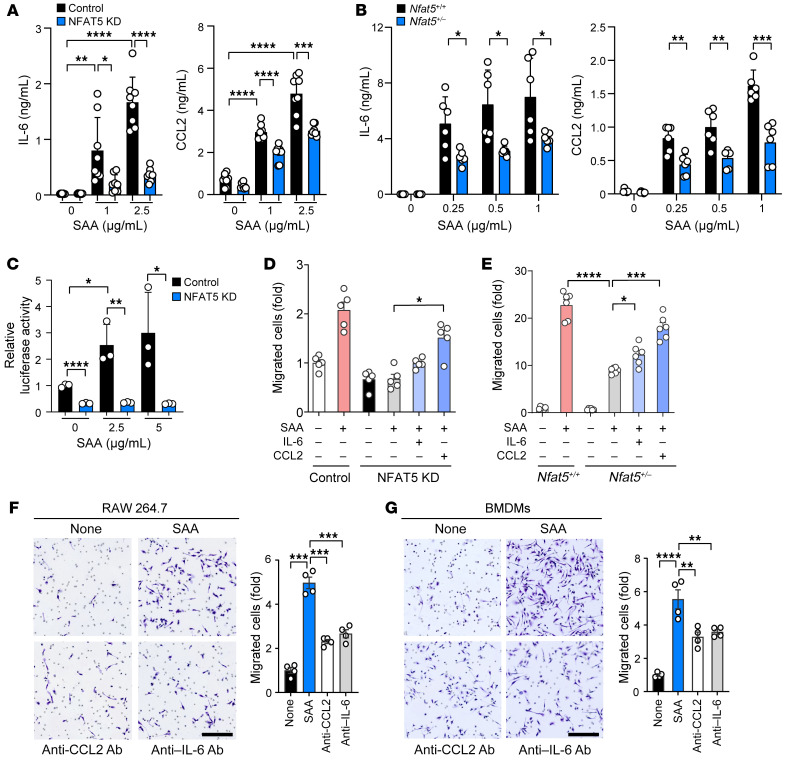
Figure 4. CCL2 and IL-6 reversal of macrophage migration repressed by Nfat5 deficiency.
(A and B) Reduced IL-6 and CCL2 production by NFAT5 KD RAW 264.7 macrophages and Nfat5+/– BMDM, as determined by ELISA. The cells were stimulated with SAA for 24 hours. IL-6 and CCL2 concentrations in the culture supernatants were determined by ELISA. (C) Decrease in SAA-stimulated CCL2 promoter activity by the knockdown of NFAT5. NFAT5 KD or control RAW 264.7 macrophages (1 × 10⁵) were transfected with CCL2 reporter plasmid (250 ng/well), and the transfected cells were then treated with the indicated concentrations of SAA for 18 hours. The CCL2 promoter activity was determined by luciferase assay. (D and E) Recovery effect of CCL2 and IL-6 on the decrease in macrophage migration by Nfat5 deficiency. In the same experimental conditions as A and B, recombinant CCL2 (10 ng/mL) or IL-6 (10 ng/mL) were added to NFAT5 KD RAW 264.7 cells (D) and Nfat5+/– BMDM (E). After 8 hours, the cell migration was determined by Boyden chamber assay. (F and G) Inhibition of macrophage migration by neutralizing Ab to CCL2 or IL-6. Anti-CCL2 Ab (1 μg/mL) or anti-IL-6 Ab (1 μg/mL) was mixed for 1 hour with the conditioned media of RAW264.7 cells (F) and BMDM (G), which were stimulated with SAA for 24 hours. Macrophage migration was assessed in a Boyden chamber 8 hours after the treatment of conditioned media in the absence or presence of the blocking Abs. Scale bars: 150 μm. Data represent mean ± SD. *P < 0.05, **P < 0.01, ***P < 0.001, and ****P < 0.0001 by Brown–Forsythe and Welch’s ANOVA (A and E), 1-way ANOVA test (D, F, and G), and Kruskal-Wallis test (B). Comparison of numerical data between groups were performed using the unpaired t test, Welch’s t test, Mann-Whitney U test or Tukey’s multiple comparisons test.

