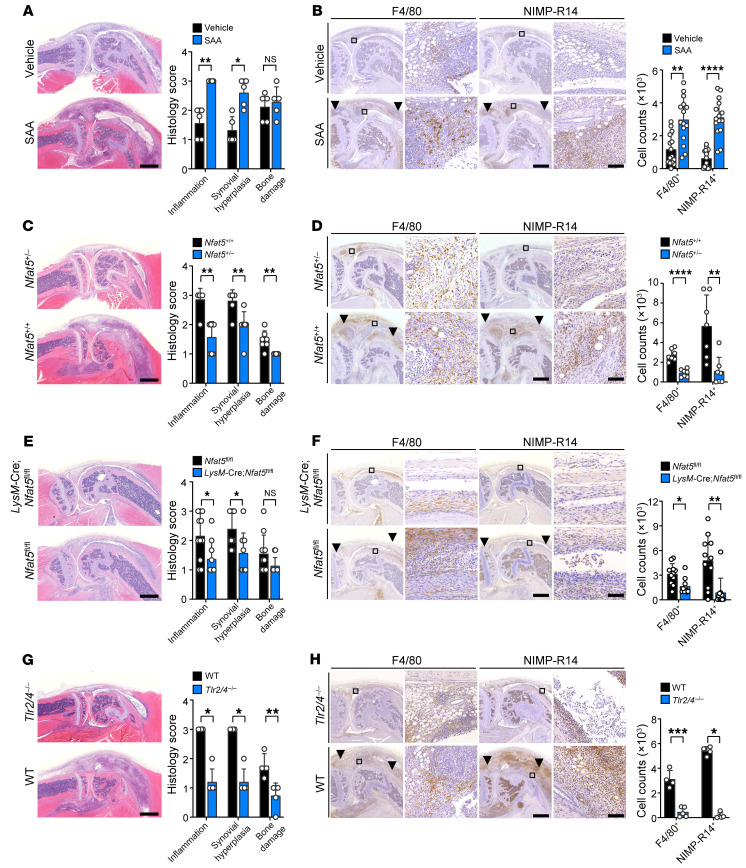
Figure 5. Aggravation of suboptimal form of IL-1β–induced arthritis by SAA-TLR2/4-NFAT5 axis.
SAA-accelerated arthritis in mice was generated by injecting SAA (5 μg × 1) in the affected joint of mice with a suboptimal form of IL-1β–induced arthritis, which was induced by injection of mBSA (200 μg × 1) and/or IL-1β (250 ng × 2) (See Supplemental Figure 8A). Arthritis severity was scored 7 days after SAA injection on a scale of 0 to 3 depending on the extent of inflammatory cell infiltration, synovial hyperplasia, and bone destruction. (A and B) Increases in the progression of chronic arthritis and infiltration of macrophages/neutrophils by intra-articular injection of SAA. The bar graphs represent mean ± SD. *P < 0.05, **P < 0.01, and ****P < 0.0001 by Mann Whitney U test for inflammatory cell infiltration and synovial hyperplasia in (A), unpaired t test for bone destruction in (A) and F4/80 in (B), and Welch’s t test for NIMP-R14 in (B). (C and D) Amelioration of SAA-accelerated arthritis and decrement of inflammatory cell (F4/80+ and NIMP-R14+ cells) infiltration by Nfat5 haploinsufficiency. The bar graphs represent mean ± SD. **P < 0.01 and ****P < 0.0001 by Mann Whitney U test for (C) and unpaired t test for (D). (E and F) Decrease in arthritis severity and inflammatory cell infiltration by specific KO of myeloid Nfat5. LysM-Cre;Nfat5fl/fl conditional KO mice were generated and subjected to SAA-accelerated arthritis. Nfat5fl/fl mice were used as controls. The bar graphs indicate mean ± SD. *P < 0.05 and **P < 0.01 by Mann Whitney U test. (G and H) Suppressive effect of Tlr2/4 KO on severity of SAA-accelerated arthritis and on infiltration of F4/80+ and NIMP-R14+ cells in the affected joints. The bar graphs indicate mean ± SD. *P < 0.05, **P < 0.01, and ***P < 0.001 by Mann Whitney U test for (G) and NIMP-R14 in (H), and unpaired t test for F4/80 in (H). Scale bars: 1 mm for H&E staining in A, C, E, and G. Scale bars for IHC staining of F4/80+ and NIMP-R14+ cells in B, D, F, and H: 500 μm for low magnification (left) and 50 μm for high magnification (right). Data in A, C, E, and G are representative of 2 independent experiments. Black arrowheads indicate F4/80+ macrophages or NIMP-R14+ neutrophils that have infiltrated into the synovium (B, D, F, and H).

