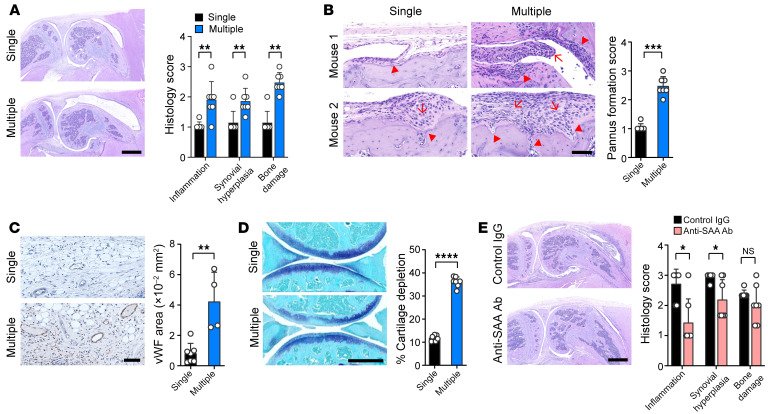
Figure 6. IL-1β–induced arthritis progresses to rheumatoid pathology by repeated challenges with SAA, whereas it is blocked by anti-SAA Ab.
(A) SAA-accelerated arthritis was induced as in Supplemental Figure 8A. After 1 week, SAA (5 μg) or vehicle alone was additionally injected into the affected joint once a week for a total of 3 times. At day 28, arthritis severity was scored on a scale of 0 to 3, depending on the extent of inflammatory cell infiltration, synovial hyperplasia, and bone destruction. The bar graph represents mean ± SD. **P < 0.01 by Mann Whitney U test. (B) The joint pathology showing resolution of arthritis in mice singly injected with SAA versus ‘pannus formation’ (arrows) in addition to a more severe bony erosion and invasion (arrowheads) in mice receiving multiple injections of SAA. The bar graph represents mean ± SD of pannus formation score. ***P < 0.001 by Mann Whitney U test. (C) The degree of angiogenesis assessed by immunostaining for vWF using anti-vWF Ab. The bar graph represents mean ± SD of the stained area (mm2). **P < 0.01 by unpaired t test. (D) Toluidine blue stain for cartilage damage of the affected (knee) joint of mice with single versus multiple SAA injection. The bar graph indicates mean ± SD. ****P < 0.0001 by unpaired t test. (E) Amelioration of IL-1β-induced arthritis by anti-SAA Ab. Neutralizing Ab to SAA (1mg/kg) was i.p. injected on days 1 and 2 into the mice with a standard form of IL-1β–induced arthritis (IL-1β: 250 ng × 3, no SAA injection). The same concentration of isotype control IgG was used as a control. At day 7, arthritis severity was evaluated. The bar graph represents mean ± SD. *P < 0.05 and **P < 0.01 by Mann Whitney U test. Data in A and E are representative of 2 independent experiments.

