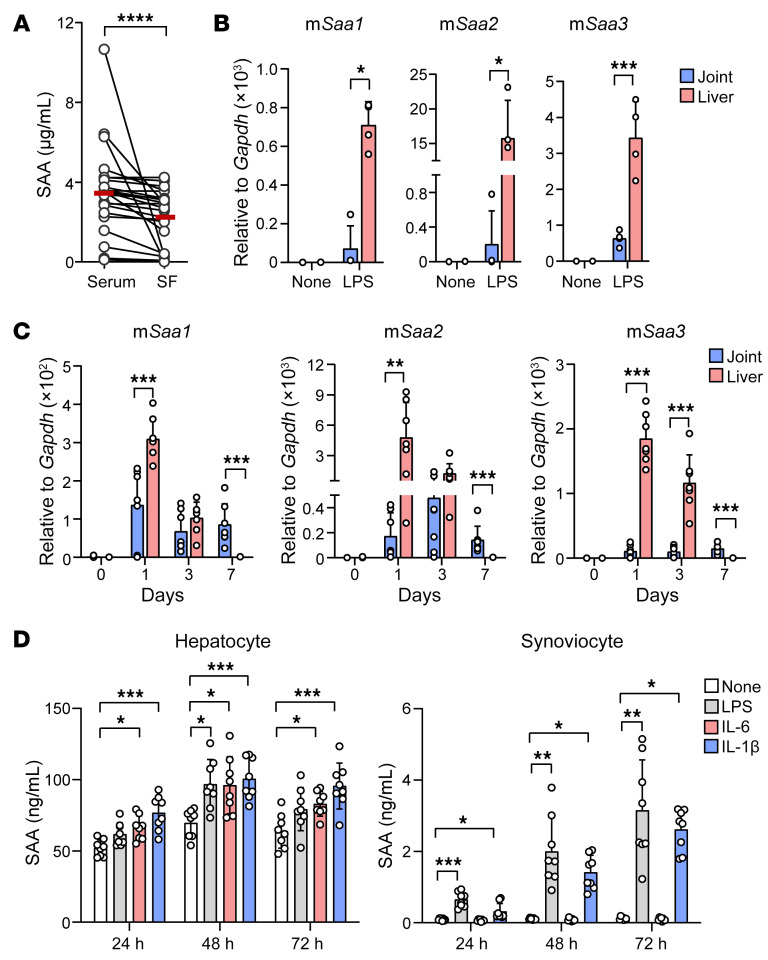
Figure 8. Liver is one of the major sources of SAA production in inflammatory arthritis.
(A) Levels of SAA in paired sera and synovial fluids isolated simultaneously from patients with RA (n = 25), as determined by ELISA. Data are mean ± SD. ****P < 0.0001 by Wilcoxon matched pairs signed rank test. (B and C) qPCR analysis of mSaa1, mSaa2, and mSaa3 mRNA expression levels in the liver and joint tissues of mice injected i.p. with 10 mg/kg of LPS (B) or in those of mice injected with mBSA (200 μg, 1 × on day 0) and/or IL-1β (250 ng, 3 × on days 0, 1, and 2) (C). Data are mean ± SD. *P < 0.05, **P < 0.01, and ***P < 0.001by Kruskal-Wallis test for mSaa1 and mSaa2 (B), Brown–Forsythe and Welch’s ANOVA test for mSaa3 (B), 2-way ANOVA test for mSaa1 and mSaa3 (C), and Friedman’s test for mSaa2 (C). Comparison of numerical data between groups were performed using the unpaired t test, Welch’s t test, or Mann-Whitney U test. Data are representative of 2 independent experiments. (D) SAA production from cultured hepatocytes and synoviocytes. Hepatocytes (1 × 10⁵/well) and fibroblast-like synoviocytes (5 × 10⁴/well), isolated from C57BL/6 mice, were stimulated with LPS (10 ng/mL), IL-6 (10 ng/mL), and IL-1β (10 ng/mL) for the indicated times. The concentration of SAA in the culture supernatants was determined by ELISA. Data are mean ± SD. *P < 0.05, **P < 0.01, ***P < 0.001, and ****P < 0.0001 by 1-way ANOVA with Tukey’s multiple comparisons test.

