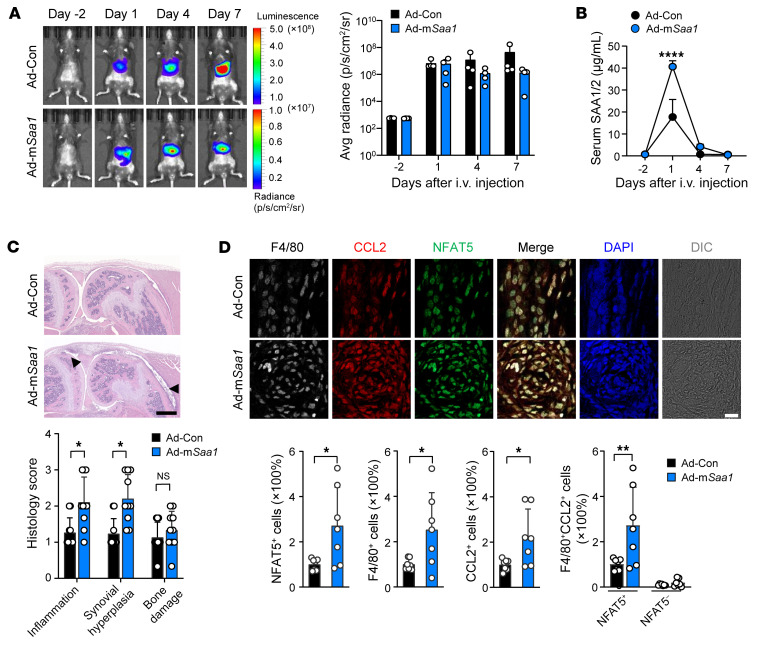
Figure 9. Accelerated chronic arthritis by forced overexpression of SAA in the liver.
(A) In vivo luciferase imaging of mouse whole body with a suboptimal form of IL-1β-induced arthritis before and after i.v. injection of Ad-mSaa1 and Ad-Con (See Supplemental Figure 8C). Mean (± SD) bioluminescence signal intensity (p/s/cm2/sr) in the liver at different time points is shown on the right. (B) SAA1/2 levels in the sera of mice with IL-1β–induced arthritis before and after injecting Ad-mSaa1 versus Ad-Con, as determined by ELISA. Data are mean ± SD. ****P < 0.0001 by 2-way ANOVA with Šidák’s multiple comparisons test. (C) Deterioration of chronic arthritis by overexpression of Saa1 in the livers of mice. 7 days after injection of Ad-mSaa1 and Ad-Con, arthritis severity was histologically assessed. The bar graph represents mean ± SD. **P < 0.01 by unpaired t test. Scale bars: 500 μm (D) Quantitation of F4/80+ macrophage infiltration and immunofluorescence colocalization for CCL2 (red), NFAT5 (green), and F4/80 (white) in the affected joints of mice with forced overexpression of Saa1 in the liver compared with control mice without Saa1 overexpression. The bar graphs indicate mean ± SD. *P < 0.05 and **P < 0.01 by Welch’s t test for NFAT5+, F4/80+, and CCL2+ cells, and by 1-way ANOVA with Tukey’s multiple comparisons test for F4/80+ CCL2+ (double positive) cells. Scale bars: 20 μm. Data are representative of 2 independent experiments.

