
Fig. 3.
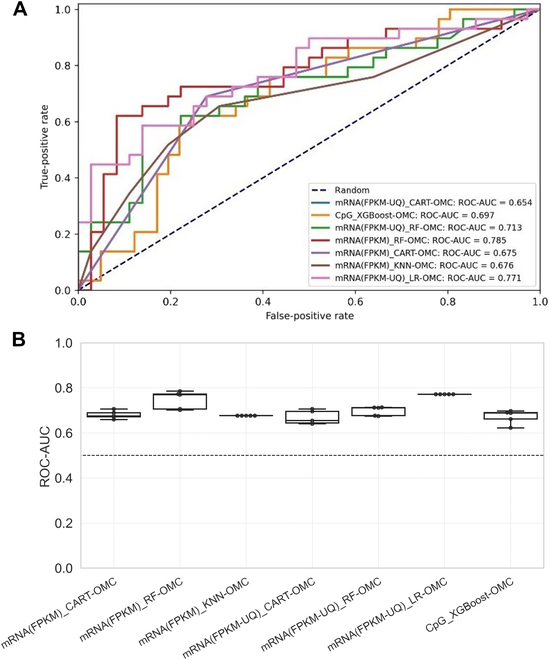
ROC-AUC across five 10-fold CV runs of the 7 most predictive models with the highest median ROC-AUC. (A) Highest ROC-AUC among five 10-fold CV runs for each model. A ROC curve depicts the trade-off between the true-positive rates and the false-positive rates of a classifier by varying the threshold of the probability of response. A ROC-AUC of 1 is the best model performance at distinguishing between responders and nonresponders, while a ROC-AUC of 0.5 corresponds to the random guessing denoted by a dashed line. RF-OMC that employed the mRNA model has the highest ROC-AUC of 0.785. (B) ROC-AUC variability across the five 10-fold CV runs for each of the 7 most predictive models with the highest median ROC-AUC. The horizontal dashed line at 0.5 represents random-level performance.