
Figure 6.
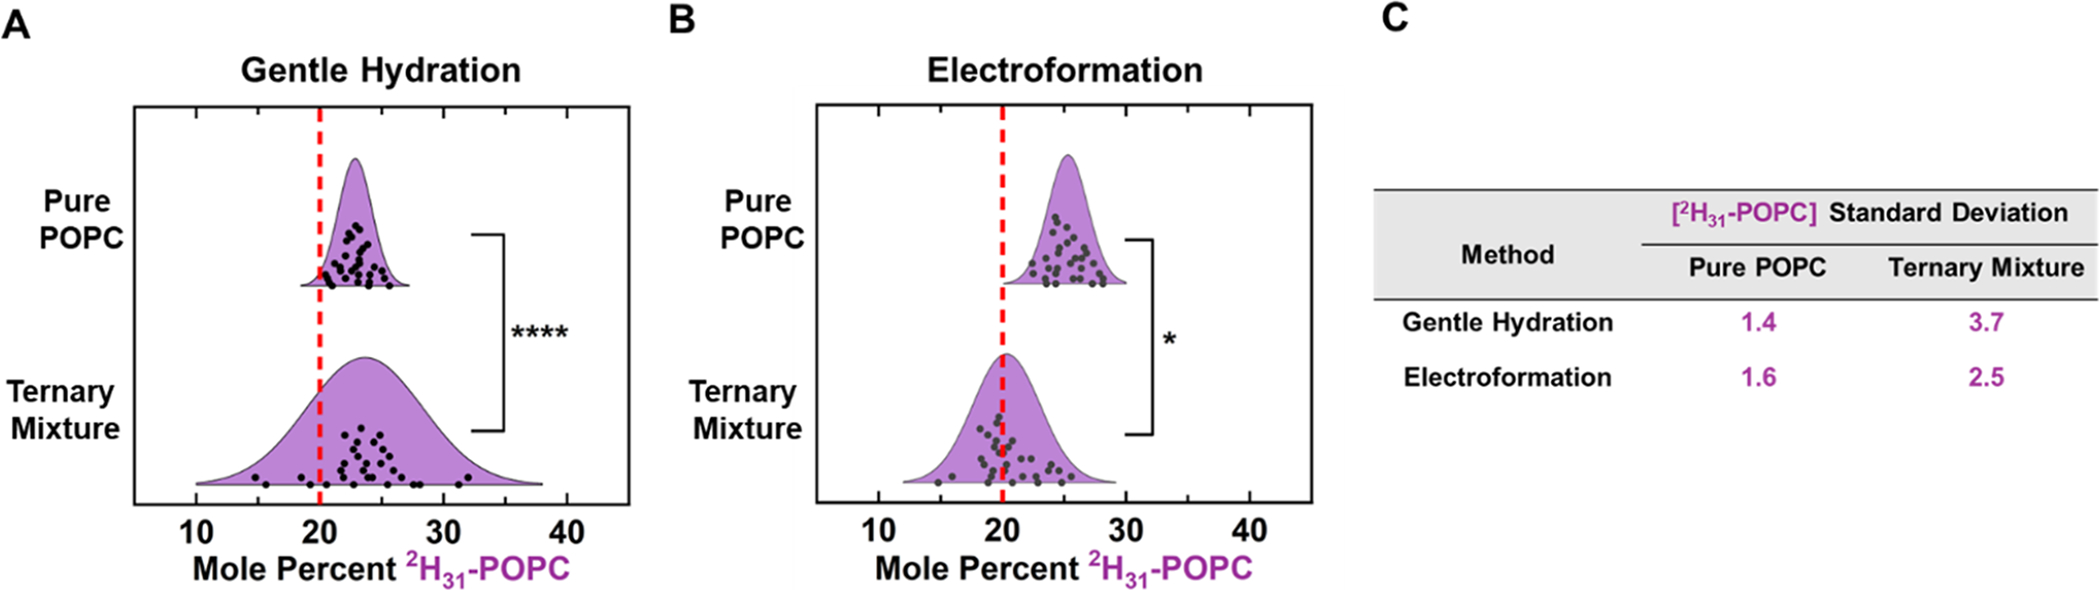
Pure and ternary mixture concentration variability. 2H31-POPC concentrations of individual GUV patches composed with pure POPC (13C18-POPC:2H31-POPC:POPC 20:20:60) or ternary (13C18-DSPC:POPC:2H31-POPC:CHOL 20:20:20:20:20) compositions were compared. Both pure POPC and ternary GUVs were formed by either electroformation (A) or gentle hydration (B). For both methods, the patches composed of pure POPC display significantly less 2H31-POPC concentration variability than that of ternary patches formed using the same method. Dot plot representations of these distributions can be seen in Figure S23. (C) Displays the calculated standard deviations for each sample.