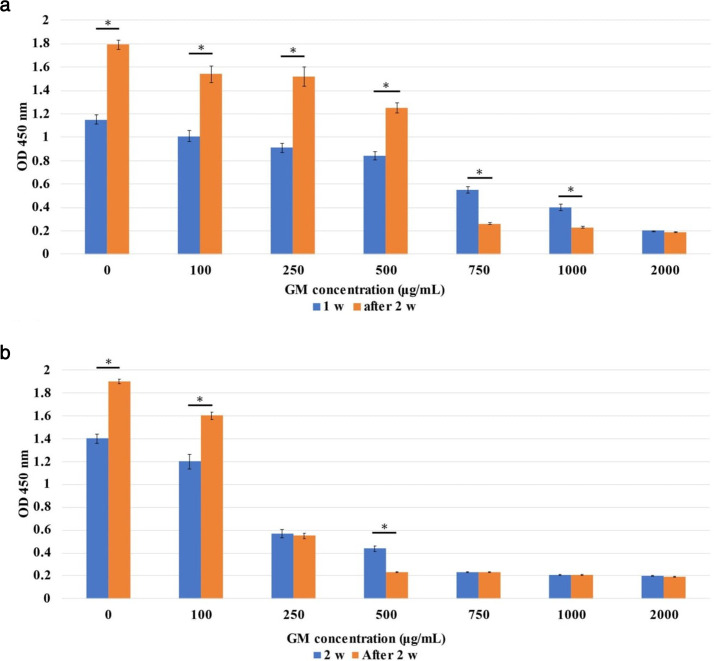
Fig. 2.
Analysis of restoration of cell viability, with absorbance comparison at each timepoint. a) Comparison of absorbance over a total of three weeks at each gentamicin (GM) concentration (after one week of exposure, followed by culturing for two weeks without GM). b) Comparison of absorbance over a total of four weeks at each GM concentration (after two weeks of exposure, followed by culturing for two weeks without GM). *p < 0.05 (Mann-Whitney U test). OD, optical density.

