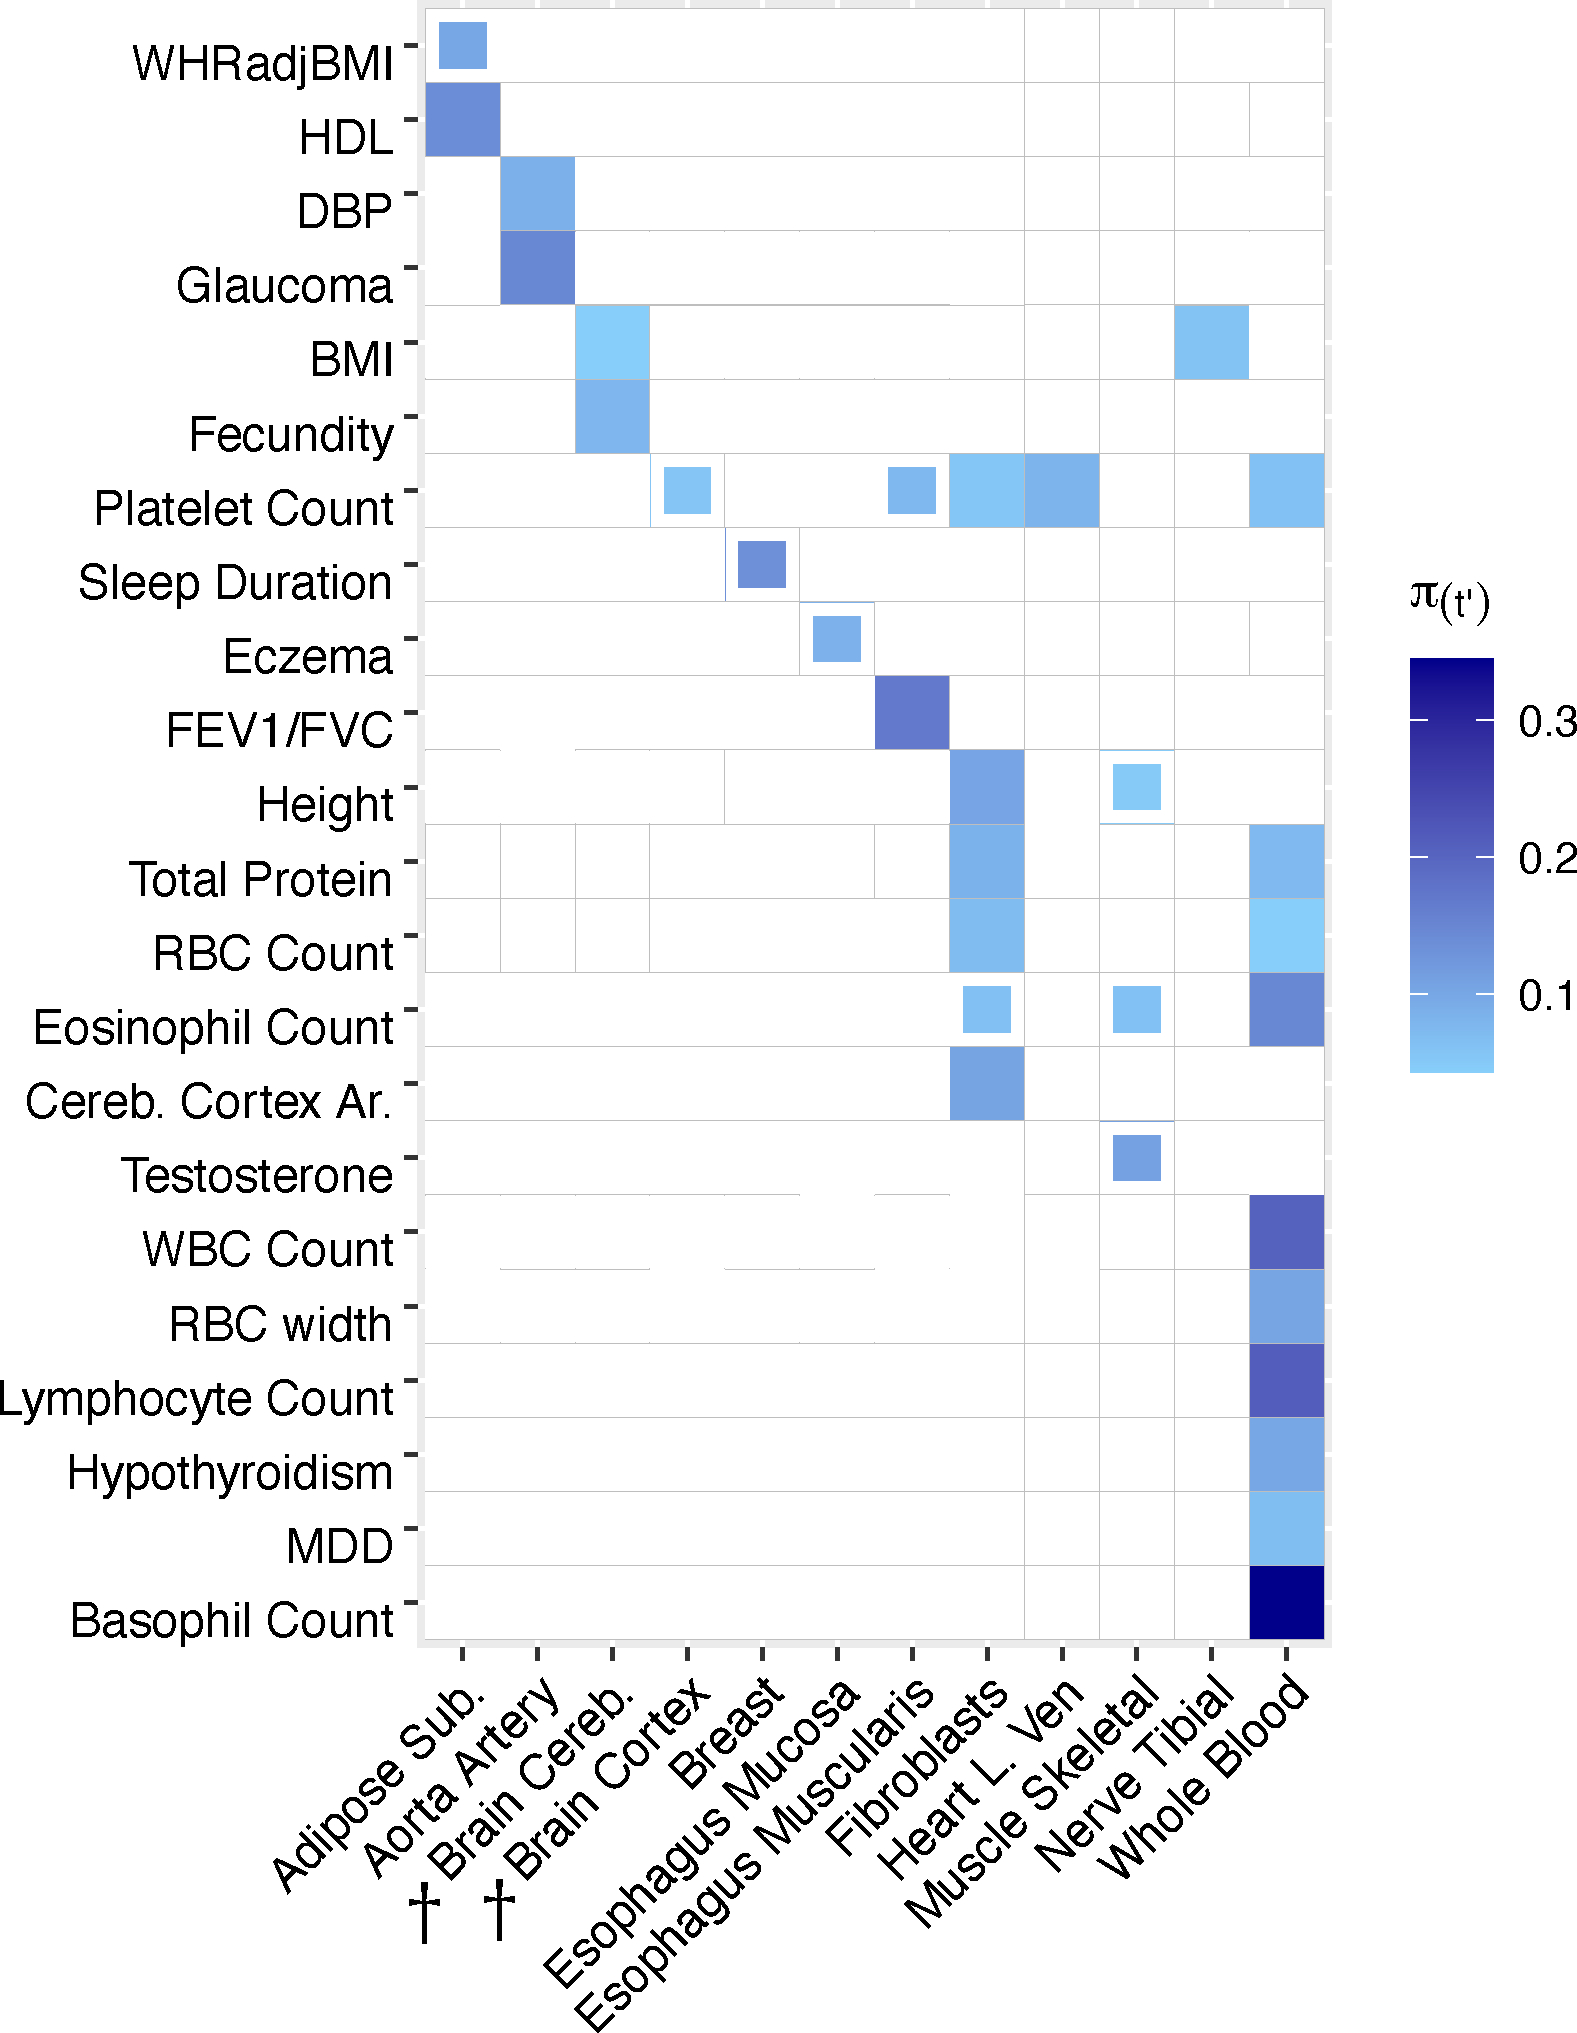
Extended Data Figure 7. Tissue-specific contributions to disease and complex trait heritability in secondary analysis of 23 tissues, removing tissues with small eQTL sample size.

We report estimates of the proportion of disease heritability explained by the cis-genetic component of gene expression in tissue ). Results are shown for tissue-trait pairs with FDR <= 10%; full boxes denote FDR of 5% or lower and partial boxes denote FDR between 5% and 10%. Tissues are ordered alphabetically. Color corresponds to , the proportion of common variant heritability causally explained by predicted gene expression in tissue . These results are largely consistent with the analysis of 39 GTEx tissues (Figure 4). WHRadjBMI: waist-hip-ratio adjusted for body mass index. HDL: high-density lipoprotein. DBP: diastolic blood pressure. BMI: body mass index. FEV1/FVC: forced expiratory volume in one second divided by forced vital capacity. Cereb. Cortex Ar.: cerebral cortex surface area. WBC Count: white blood cell count. RBC Count: red blood cell count. MDD: major depressive disorder. Daggers next to a tissue indicate a meta-tissue.
