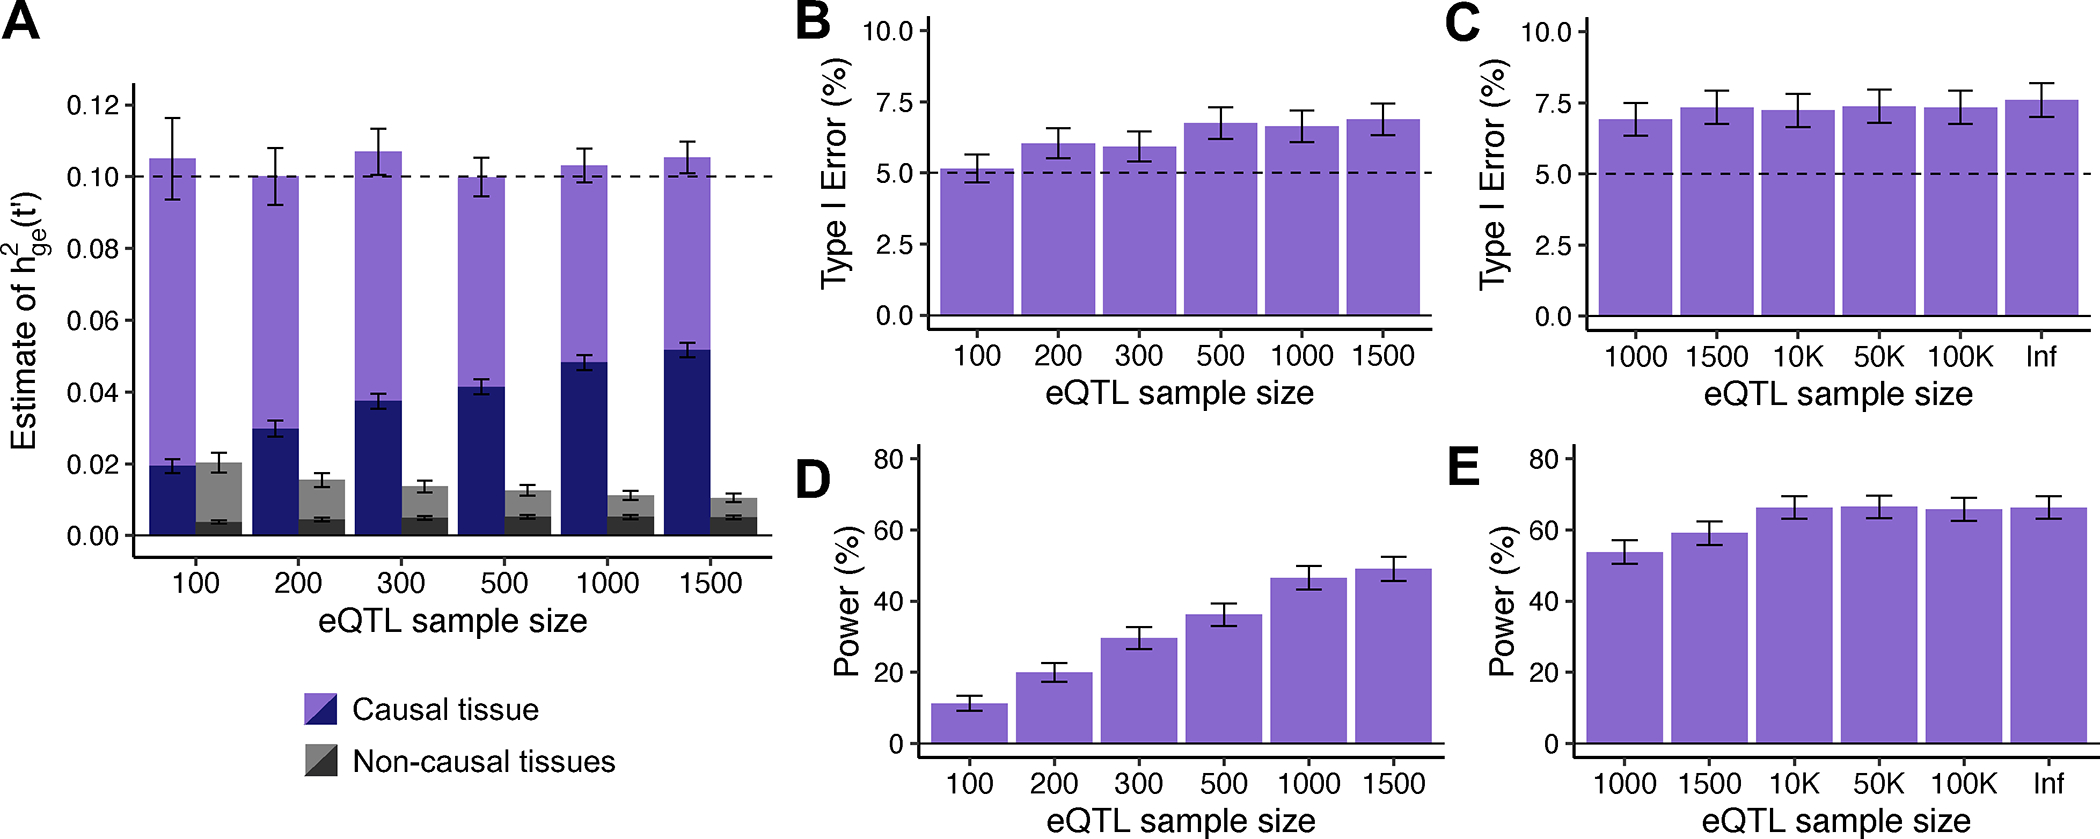
Figure 2. Robustness and power of TCSC regression in simulations.

(A) Bias in estimates of disease heritability explained by the cis-genetic component of gene expression in tissue for causal (purples) and non-causal (grays) tissues. was set to the total number of true cis-heritable genes across tissues for light purple (resp. gray) or to the number of significantly cis-heritable genes in each tissue for dark purple (resp. gray). The dashed line indicates the true value of for causal tissues. (B) Percentage of estimates of for non-causal tissues that were significantly positive at p < 0.05 per eQTL sample size (n = 100, 200, 300, 500, 1000, 1500). (C) Percentage of estimates of for non-causal tissues that were significantly positive at p < 0.05 per larger eQTL sample size (n = 1000, 1500, 10K, 50K, 100K, Infinite). (D) Percentage of estimates of for causal tissues that were significantly positive at p < 0.05 per eQTL sample size (n = 100, 200, 300, 500, 1000, 1500). (E) Percentage of estimates of for causal tissues that were significantly positive at p < 0.05 per larger eQTL sample size (n = 1000, 1500, 10K, 50K, 100K, Infinite). For panels B-E, we used a one-sided z-test to obtain p-values. For panels A, B and D, we performed n = 1,000 independent simulations per eQTL sample size. For panels C and E, we performed n = 2,000 independent simulations per eQTL sample size and used cross-validation adjusted-R2 > 0 instead of GCTA to define significantly cis-heritable genes in these analyses. In all panels, data are presented as mean values +/− 1.96 × SEM. Numerical results are reported in Supplementary Table 1.
