
Figure 3. TCSC estimates tissue-specific contributions to disease and complex trait heritability.
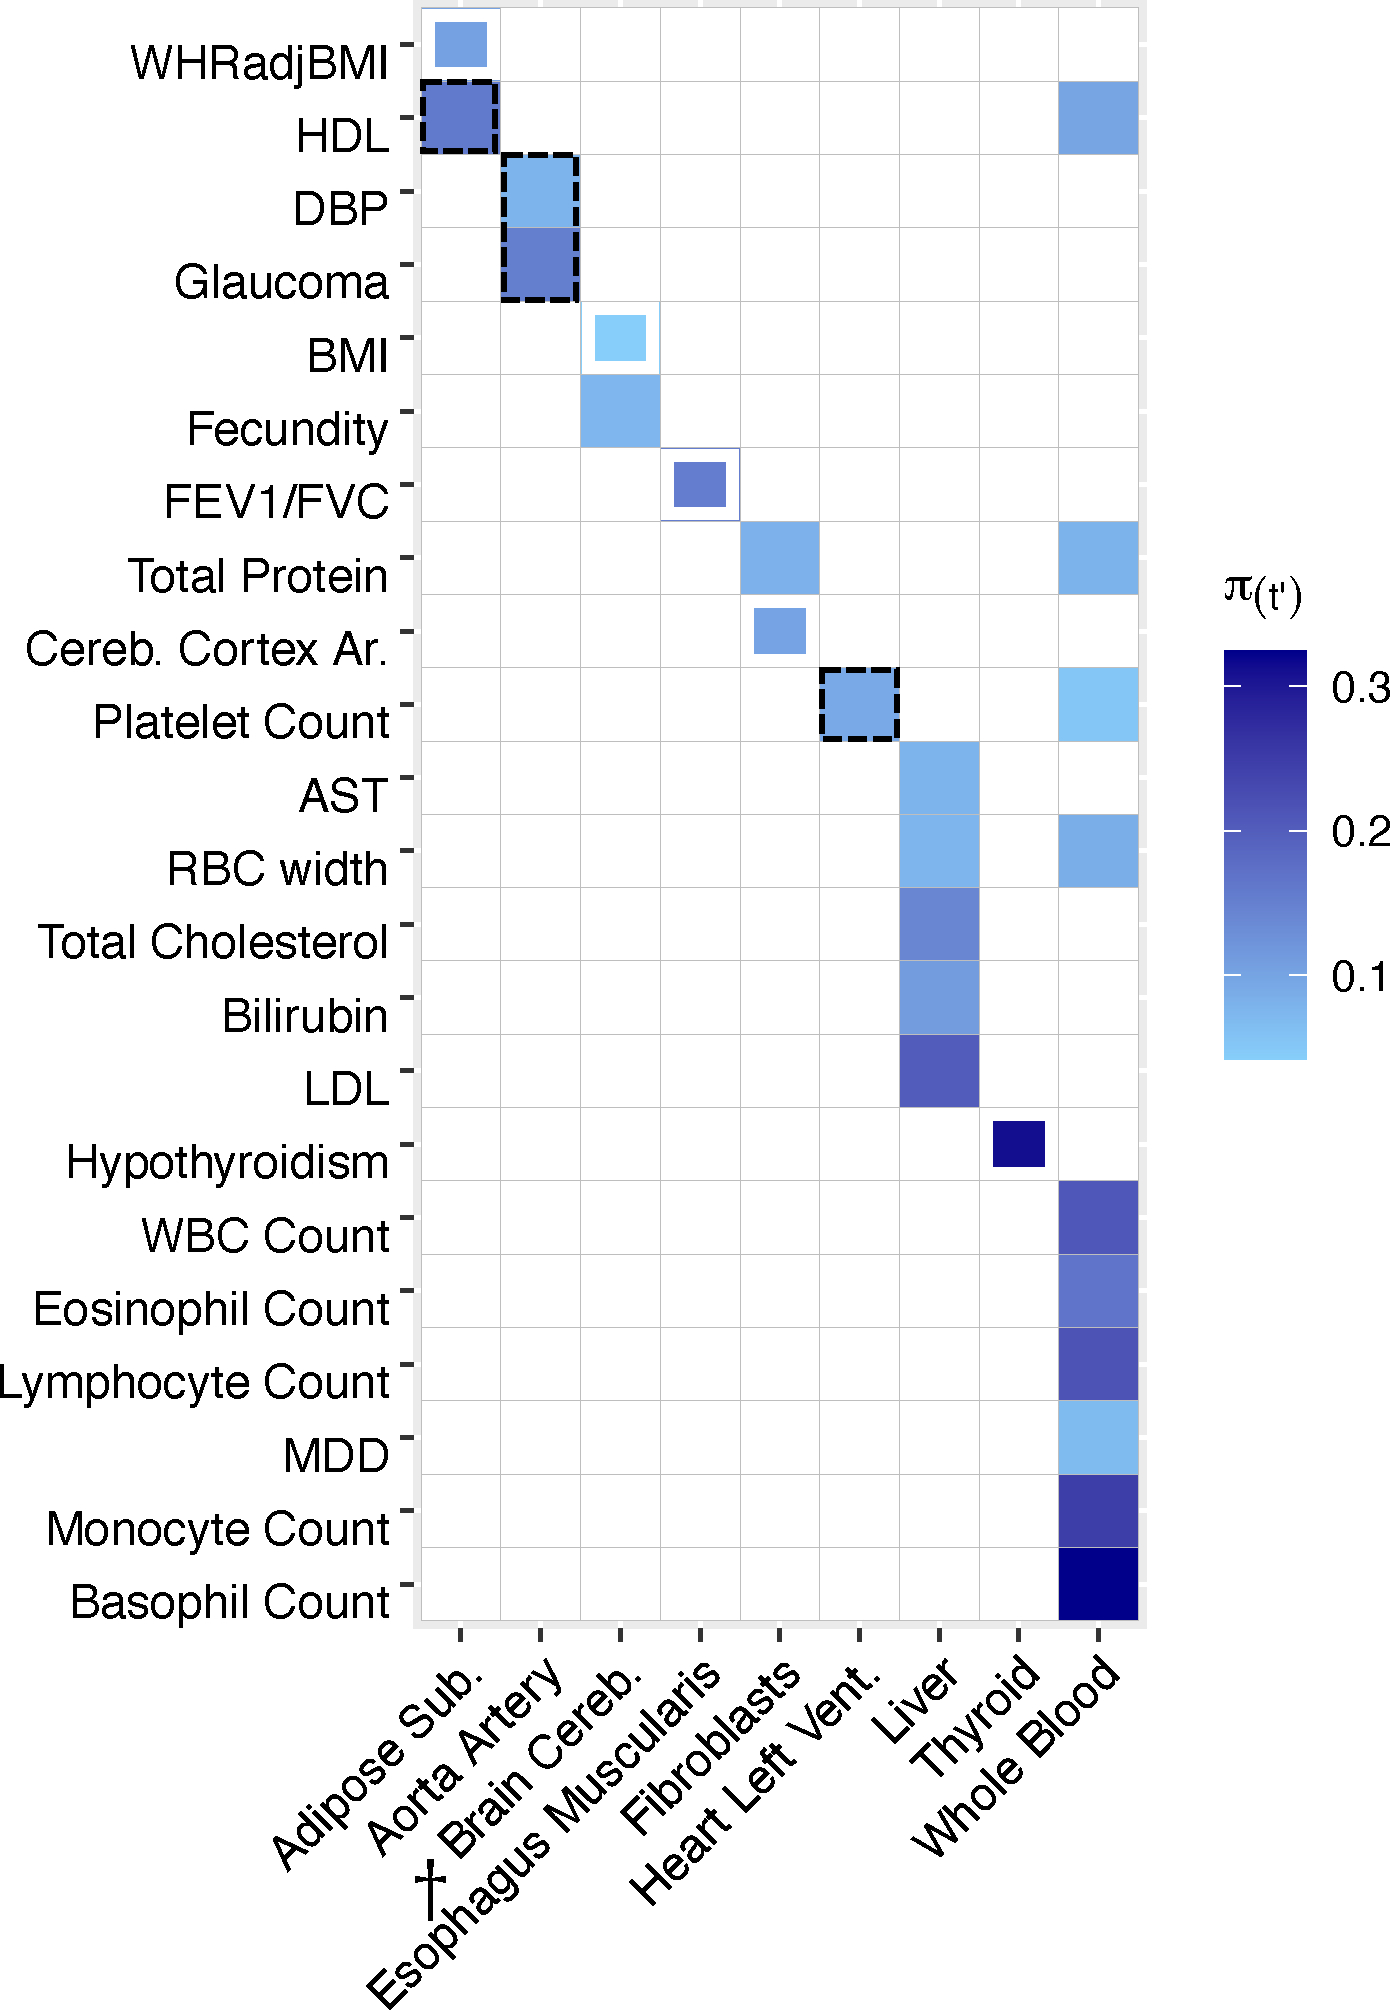
We report estimates of the proportion of disease heritability explained by the cis-genetic component of gene expression in tissue ). We report tissue-trait pairs with FDR of 10% or lower, where full boxes denote FDR of 5% or lower and partial boxes denote FDR between 5% and 10%. Dashed boxes denote results that are highlighted in the main text. Tissues are ordered alphabetically. Daggers denote meta-tissues with more than one constituent tissue. Diseases/traits are ordered with respect to causal tissues. Numerical results are reported in Supplementary Tables 5–6. WHRadjBMI: waist-hip-ratio adjusted for body mass index. HDL: high-density lipoprotein. DBP: diastolic blood pressure. BMI: body mass index. FEV1/FVC: forced expiratory volume in one second divided by forced vital capacity. Cereb. Cortex Ar.: cerebral cortex surface area. AST: aspartate aminotransferase. LDL: low-density lipoprotein. WBC Count: white blood cell count. MDD: major depressive disorder.