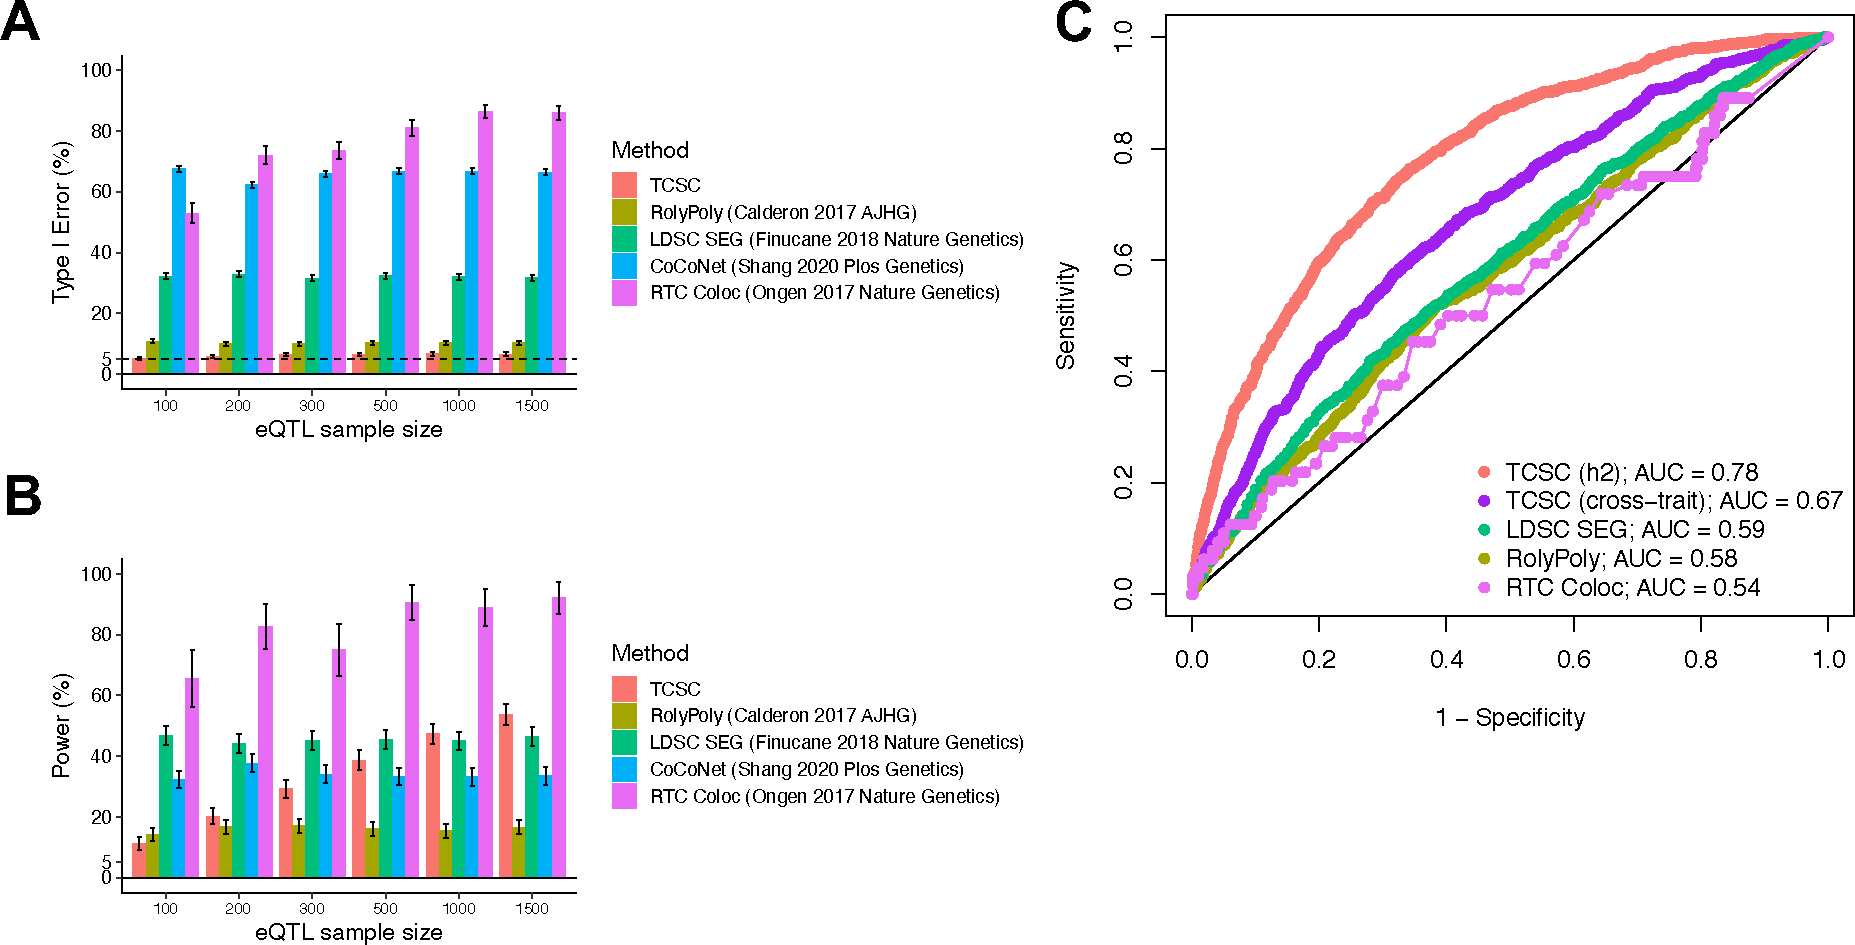
Extended Data Figure 1. Comparison of tissue-trait association methods with TCSC in simulations.

(A) Percentage of estimates of for non-causal tissues that were significantly positive at p < 0.05. is set to 10% and GWAS sample size is set to 10,000. (B) Percentage of estimates of for causal tissues that were significantly positive at p < 0.05. In panels A and B, we performed n = 1,000 independent simulated genetic architectures for TCSC, LDSC-SEG, CoCoNet, and RolyPoly and n = 100 independent simulated genetic architectures for RTC Coloc due to the computationally intensive nature of the method across each eQTL sample size (n = 100, 200, 300, 500, 1000, 1500); we used a one-sided z-test and the genomic block jackknife standard error to obtain p-values and data are presented as mean values +/− 1.96 × SEM. (C) Receiver operating characteristic (ROC) curves for each method, including cross-trait TCSC, across 1,000 uniformly spaced p-values between 0 and 1 used as the threshold to identify a causal tissue at a simulation eQTL sample size of 300, most closely matching real data analysis. We note that CoCoNet cannot be compared here because the method identifies the single most likely causal tissue using maximum likelihood estimation rather than via p-value. Numerical results are provided in Supplementary Tables 1 and 2.
