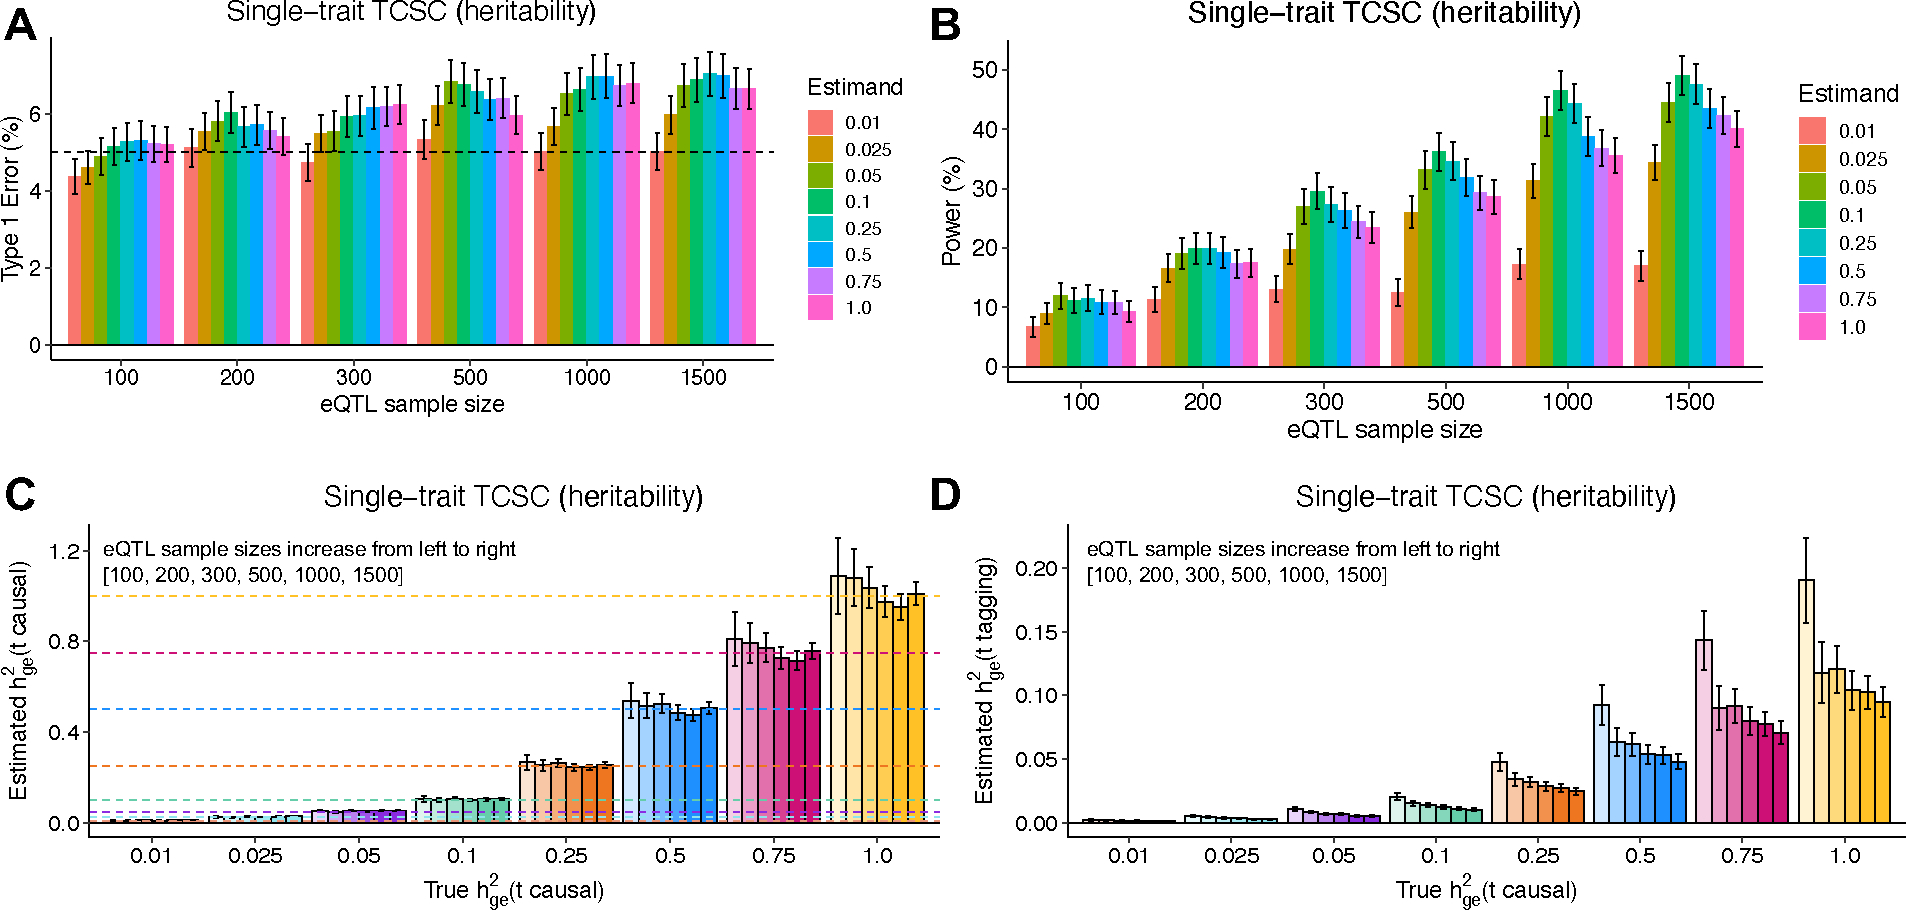
Extended Data Figure 3. Robustness and power of TCSC regression in simulations with different values of

(A) Type I error per true value of in the causal tissue. False positive event is defined as for non-causal tissues at p < 0.05. (B) Power to detect the causal tissue per true value of in the causal tissue. A true positive event is defined as > 0 for causal tissues at p < 0.05. (C) Bias on causal estimates of for different true values of the causal tissue . Dashed lines indicate true values of . (D) Bias on non-causal estimates of for different true values of the causal tissue . In all panels, we performed n = 1,000 independent simulated genetic architectures across different eQTL sample sizes (n = 100, 200, 300, 500, 1000, 1500); we used a one-sided z-test and the genomic block jackknife standard error to obtain p-values and data are presented as mean values +/− 1.96 × SEM. The value of is set to the total number of unique cis-heritable genes across all tissues.
