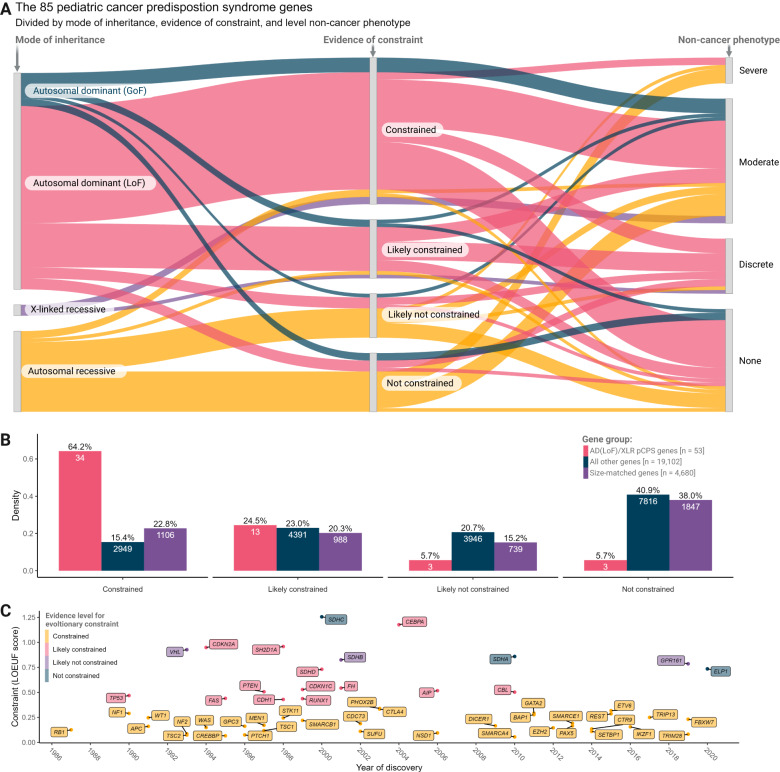
Fig. 3. Genic level of loss-of-function constraint in phenotypic context.
A Sankey plot showing genes associated with, monoallelic and biallelic childhood cancer risk phenotypes and their relation to level of constraint for loss-of-function mutations and severity of associated non-cancer phenotype. Colors indicate mode of inheritance (MOI); autosomal dominant MOI caused by gain-of-function (GoF) variation (blue), autosomal dominant MOI caused by loss-of-function (LoF) variation (red), X-linked recessive MOI (purple), autosomal recessive MOI (yellow). B Bar plot showing density of genes with each level of constraint for each gene group as indicated; autosomal dominant MOI caused by LoF variation or X-linked recessive MOI (AD(LoF)/XLR) pediatric cancer predisposition syndrome (pCPS) genes (red), all other genes (blue), and size-matched genes (purple). Numbers inside bars show number of genes. C Timeline showing year of pCPS gene discovery and level of constraint, with genes colored by level of constraint; constrained (yellow), likely constrained (red), likely not constrained (purple), and not constrained (blue). LOEUF, LoF observed vs. expected upper bound fraction. Source data are provided as a Source Data file.

