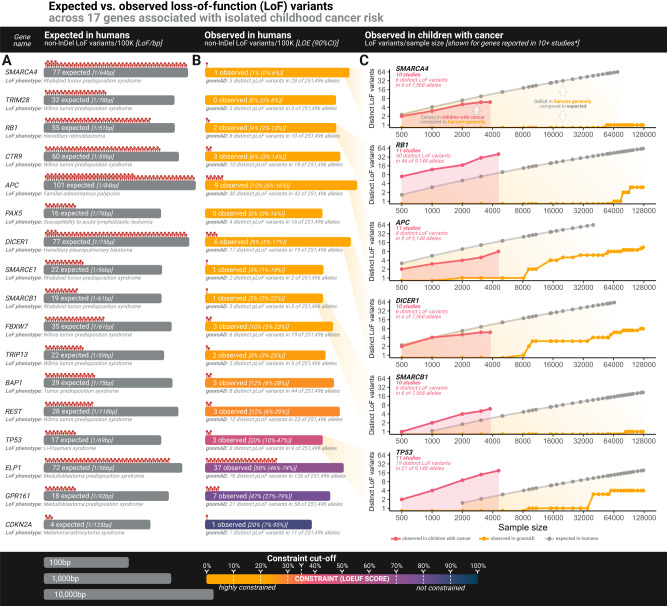
Fig. 4. Loss-of-function mutational spectra of genes linked with isolated childhood cancer risk.
A Visual illustration of the calculated number of non-insertion/deletion (non-InDel) loss-of-function (LoF) variants expected per 100,000 individuals in adults. Grey bar size represents gene size on a log10 scale as indicated. bp, base pair. B Number of non-InDel LoF variants actually observed in adults. Bar color represents level of constraint as indicated. C Log-scaled point graphs showing number of distinct LoF variants at various sample sizes, with colors representing gnomAD data, pediatric pan-cancer data or expected number as indicated. For gnomAD data and pediatric pan-cancer data, the dots with the highest x-axis value of each plot correspond to actually observed LoF variants in the full data, with other dots representing number of observed LoF variants at 38 downsampling steps (precomputed for gnomAD with pediatric pan-cancer internally computed to match, see “Methods and Data Availability”). The expected number of LoF variants at each downsampling step were precomputed as detailed by Karczewski et al.36 and is publicly available from gnomAD (see Data Availability). *BAP1 and CDKN2A were reported in 10 pediatric pan-cancer studies, but were not included in this figure due to figure size/readability. Graphs for all 11 genes not shown here are in Supplementary Fig. 3. 100 K, 100,000 individuals, LOE, LoF observed vs. expected ratio, 90% CI, 90% confidence interval. Source data are provided as a Source Data file.

