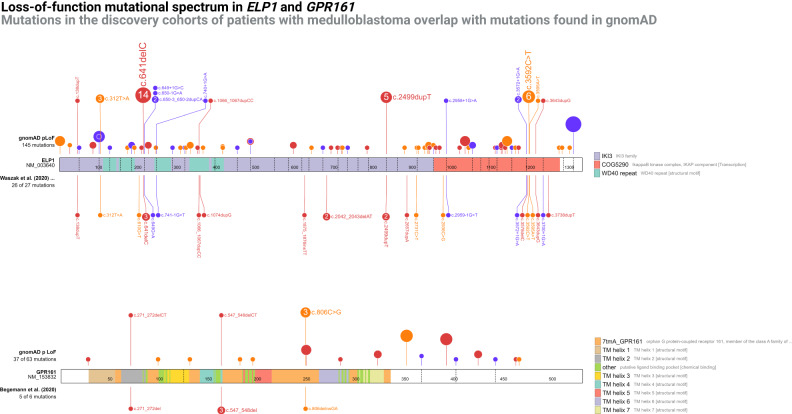
Fig. 6. Mutational spectra in recent medulloblastoma predisposition genes.
Upper diagram shows the ELP1 gene, with the upper tract representing the loss-of-function variants found in gnomAD v2.1 and the lower tract showing the loss-of-function variants found among patients with medulloblastoma by Waszak et al.73. Variants are expanded in the upper tract when they overlap with variants in the lower tract. Lower diagram shows the GPR161 gene with the upper tract representing the loss-of-function variants found in gnomAD v2.1 and the lower tract showing the loss-of-function variants found among patients with medulloblastoma. Variants are expanded in the upper tract when they overlap with variants in the lower tract. Variant color; orange, nonsense, purple, splice, red, frameshift. Source data are provided as a Source Data file.

