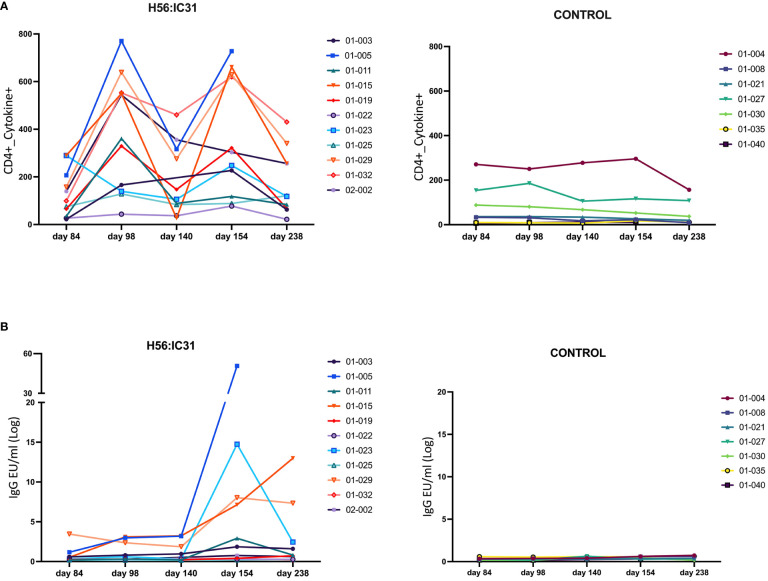
Figure 3.
Individual and longitudinal humoral and cellular responses in the H56:IC31 and Control groups. (A) Individual cellular Cytokine+ CD4 T cell (sum of IFNγ and IL-2 responses to Ag85B, and ESAT-6) responses represented as Spots Forming Units (SFU)/300,000 cells, and (B) Log transformed anti-H56 IgG serum levels (EU/ml), from day 84 to day 238. Individual responses at all time points are represented using separate coloured linear diagrams for H56:I31 vaccinated and Control patients.

