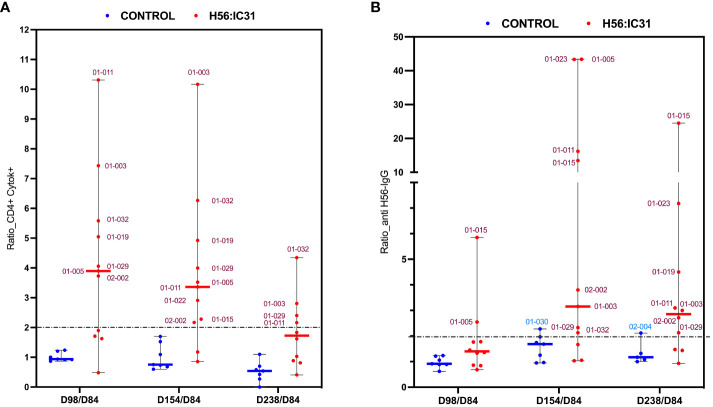
Figure 4.
Ratios of humoral and cellular responses at different time points post-vaccination versus day 84. (A) Ratio of Cytokine+ CD4 T cell responses, and (B) ratio of log transformed anti-H56 IgG serum levels at day 98 versus day 84, day 154 versus day 84, and day 238 versus day 84, represented using boxplots with medians and range of values. H56:IC31 vaccinated patients are represented by red dots and Controls by blue dots. The cut-off established to define vaccine mediated immune responses is represented by a discontinued line at ratio equal 2. Patient’s ID are specified in the graphics for those who showed a ≥ 2-fold increase of immune responses post-vaccination.

