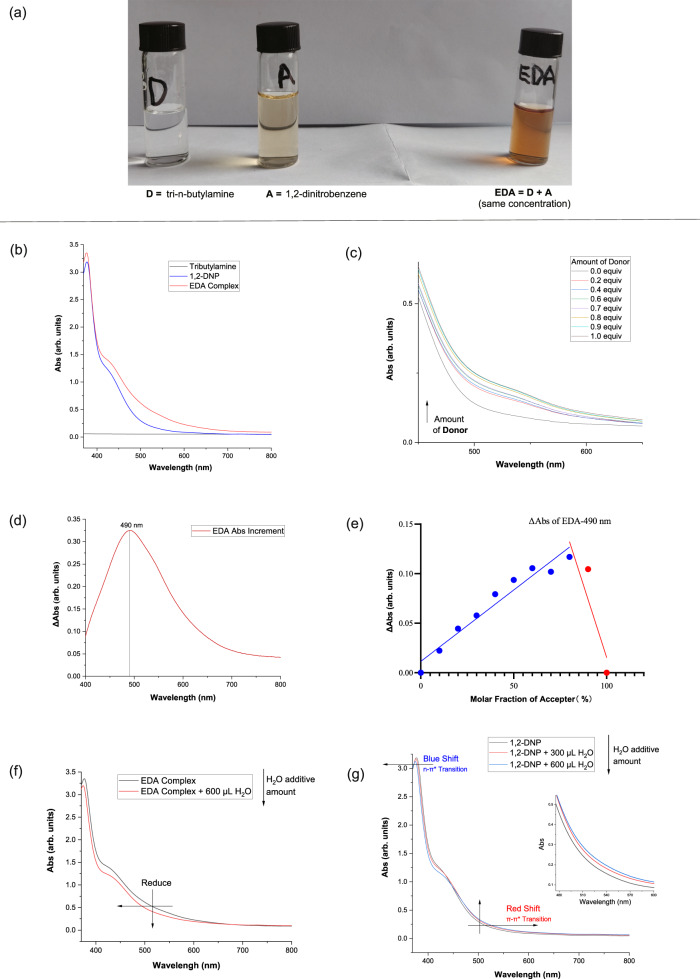
Fig. 2. Mechanistic experiments.
a Visual photograph of donor, acceptor and EDA complex. b Optical absorption spectra, the separate reaction components and appearance of the colored EDA complex. c UV-Vis absorption spectra of acceptor and that with different molar ratio of donor. d EDA Complex absorbance increment. e Job’s Plot. f Water hydrolysis of the EDA Complex. g The impact of water on the UV-visible absorption spectra of acceptor. a.u. arbitrary units.

